
FIGURE 4.
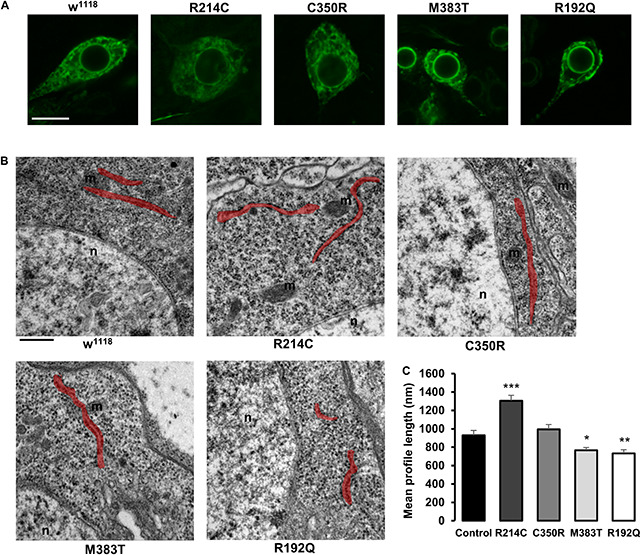
(A) Confocal microscopy images of third instar larva brain motor neurons of CRISPR mutants expressing the ER marker BiP-sfGFP-HDEL with the driver D42-Gal4. Scalebar 10 μm (B) TEM images of third instar larva brains neurons of CRISPR mutants. ER profiles are highlighted in red. Scalebar 500 nm (C) Quantification of the mean length of ER profiles measured in TEM sections. Mean ± SEM, n ≥ 50 profiles. *p < 0.05, **p < 0.01, ***p < 0.001.