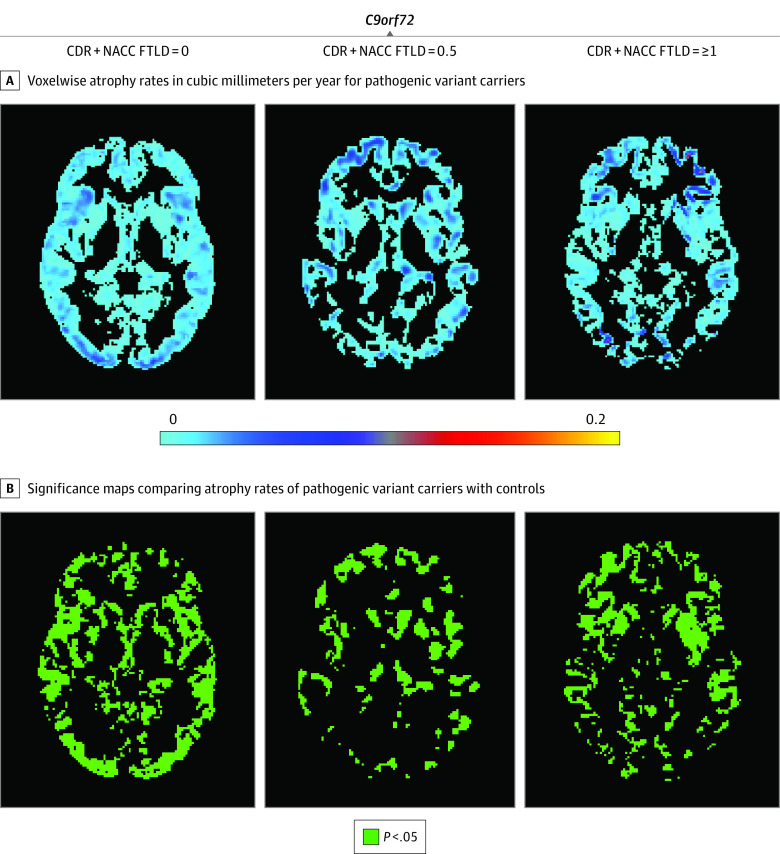
Figure 3. Maps of Voxelwise Atrophy Rate in C9orf72 Repeat Expansion Carriers at 3 Levels of Disease Severity.
A, More positive values represent faster rates of atrophy. Based on our hypothesis, only those voxels that show rates of atrophy are presented; extending the color scale to voxels that were estimated to show volume growth would decrease interpretability by compressing the color scale in voxels of interest (those showing volume loss). B, Green voxels are statistically significant at P < .05 after familywise error correction for multiple comparison at each voxel. Statistically significant increased rates of volume loss compared with controls were observed at all stages. In contrast to carriers of pathogenic variants in the other 2 genes, C9orf72 repeat expansion carriers showed little acceleration across disease stages, even with transition to dementia. Regions with the largest effect sizes were distributed among frontal, temporal, and parietal regions in C9orf72+. CDR + NACC FTLD indicates Clinical Dementia Rating plus National Alzheimer’s Coordinating Center Frontotemporal Lobar Degeneration.

