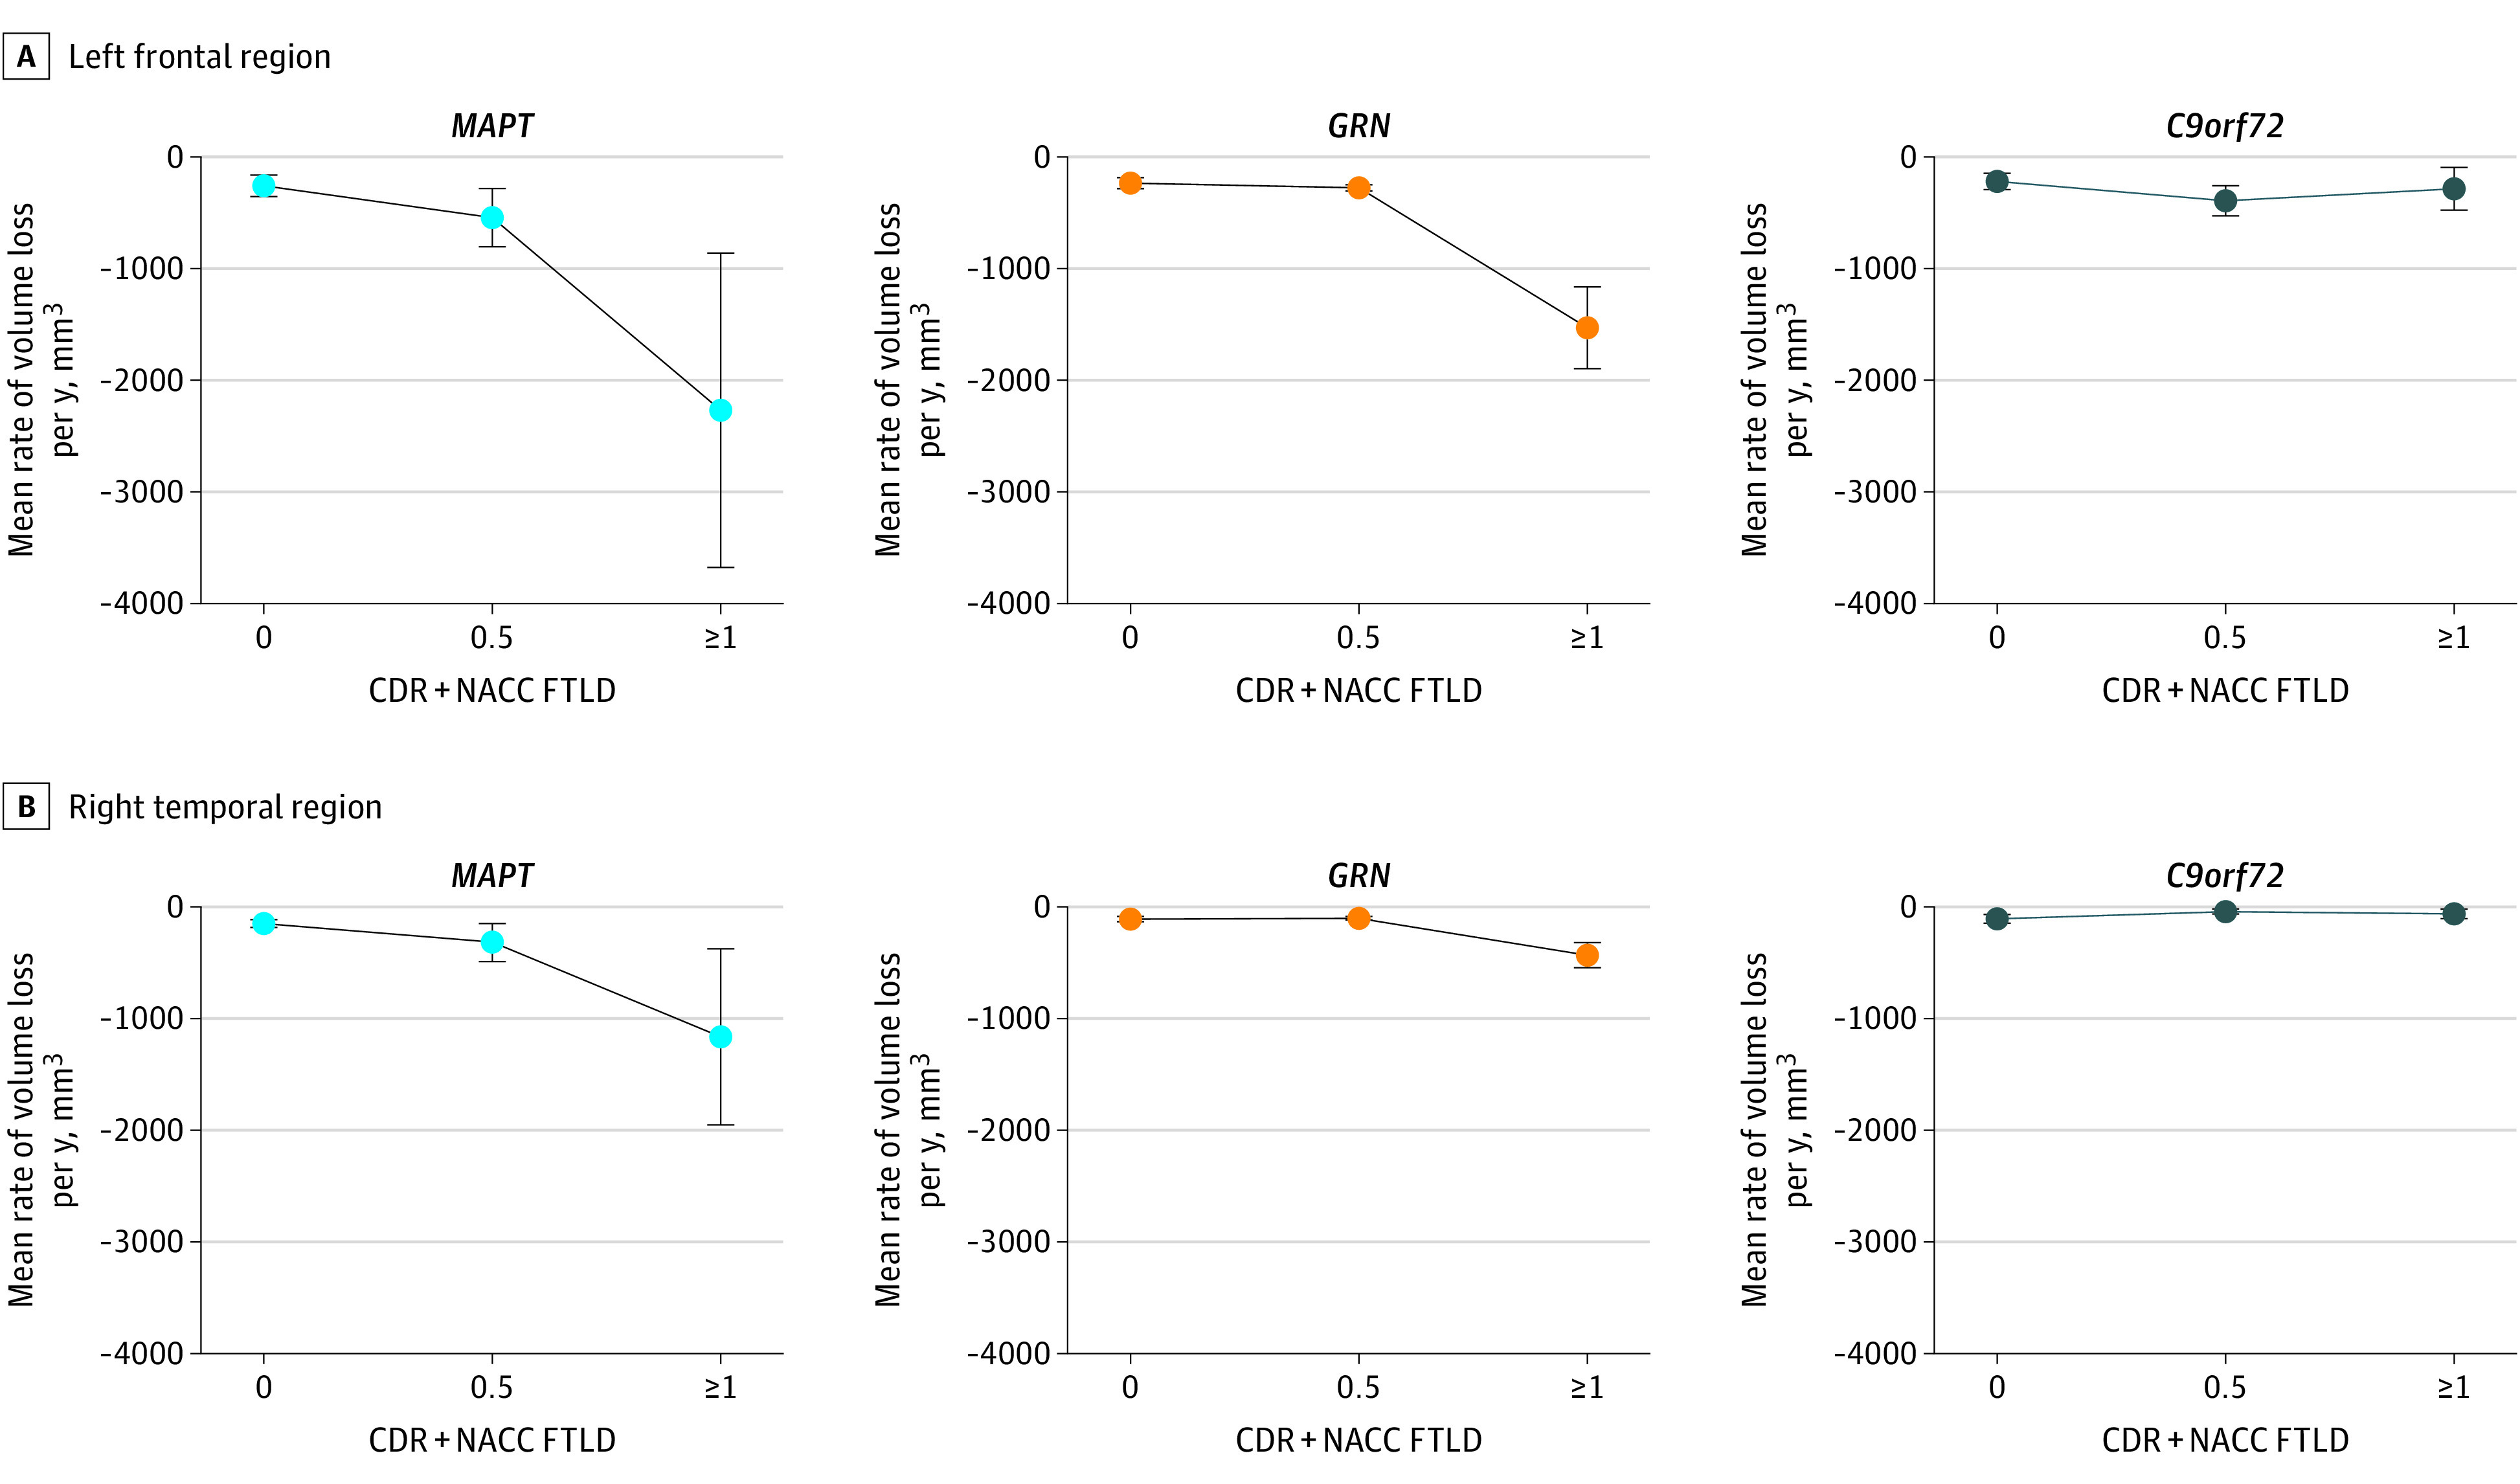
Figure 4. Mean Rates of Volume Loss for Frontal and Temporal Regions of Interest.

Examination of mean rates of volume loss in several regions of interest highlights how the consequences of disease stage vary by genetic group, with C9orf72 repeat expansion carriers showing the least increase in the rate of atrophy as disease severity increases. GRN pathogenic variant carriers showed almost no differences in the rate of volume loss between CDR + NACC FTLD 0 and 0.5 stages, whereas a large increase in the rate of volume loss was observed between the 0.5 and 1 or greater stages. CDR + NACC FTLD indicates Clinical Dementia Rating plus National Alzheimer’s Coordinating Center Frontotemporal Lobar Degeneration. Error bars indicate SDs.
