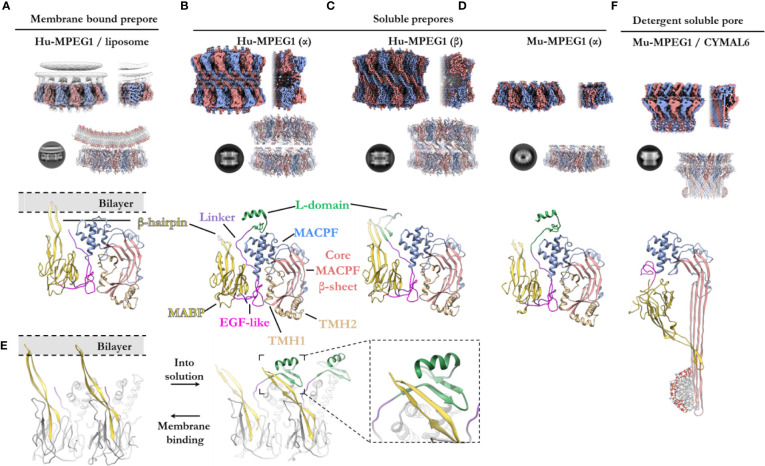
Figure 5.
The various structural states of MPEG1. (A) When incubated with liposomes (gray), MPEG1 binds the lipid bilayer as a single prepore ring, via the MABP β-hairpin (yellow), orienting the MACPF domain away from the lipid bilayer [PDB: 6U2W] (82). Lipids are illustrated with a cartoon model. Both the unsharpened (gray) and sharpened (alternating color) maps are superimposed to illustrate the lipid density (gray). (B) In solution, recombinant MPEG1 (truncated between the L-domain [green] and TM region [not shown]) forms a loosely associated ring–ring dimer whereby the helix of the L-domain mediates interactions between rings (termed the α-conformation) [PDB: 6U2J, 6U2K] (82). (C) A second, tightly associated ring–ring dimer is also possible; this conformation is defined by inter-ring strand swapping (termed the β-conformation) [PDB: 6U2L] (82). This is achieved by the L-domain which adopts an extended β-sheet conformation. (D) Murine MPEG1 truncated at a similar position to (A, B), forms single ring structures after prolonged incubation in acidic conditions [PDB: 6SB3] (83). These rings were observed in the α-conformation (with respect to the L-domain). (E) A view of an MPEG1 dimer is shown from the periphery of the complex in both the membrane-bound (left) and soluble prepore (right) states. Upon interchanging between these states, the L-domain and β-hairpin undergo conformational change. Inset shows a magnified view of the interaction. (F) Incubation of murine MPEG1 at low pH and in the presence of the detergent CYMAL6 results in MPEG1 pores [PDB: 6SB5] (83) where the MABP domain is flipped relative to (A–D). This conformational change re-orients the MACPF and MABP domains into the same direction. The extremity of the β-barrel forms an amphipathic region (illustrated by a cartoon micelle). Top row: CryoEM reconstructions of MPEG1 (alternating colors show individual subunits) of the overall quaternary structure. Both the full reconstruction (left) and a partial cross section (right) are shown for each panel (A–D, F). The cross section enables visualization of the inner structure of the complex. Second row: Exemplar 2D class averages are shown below each reconstruction [reproduced from (82, 83)]. The atomic coordinates for the full reconstruction are shown next to the corresponding 2D class average (alternating colours show individual subunits). Third row: A single magnified subunit from each complex is shown. MACPF β-sheet (red), TMH regions (tan), MACPF core (blue), MABP/β-hairpin (yellow), EGF-like (pink), linker region (purple), L-domain (green).

