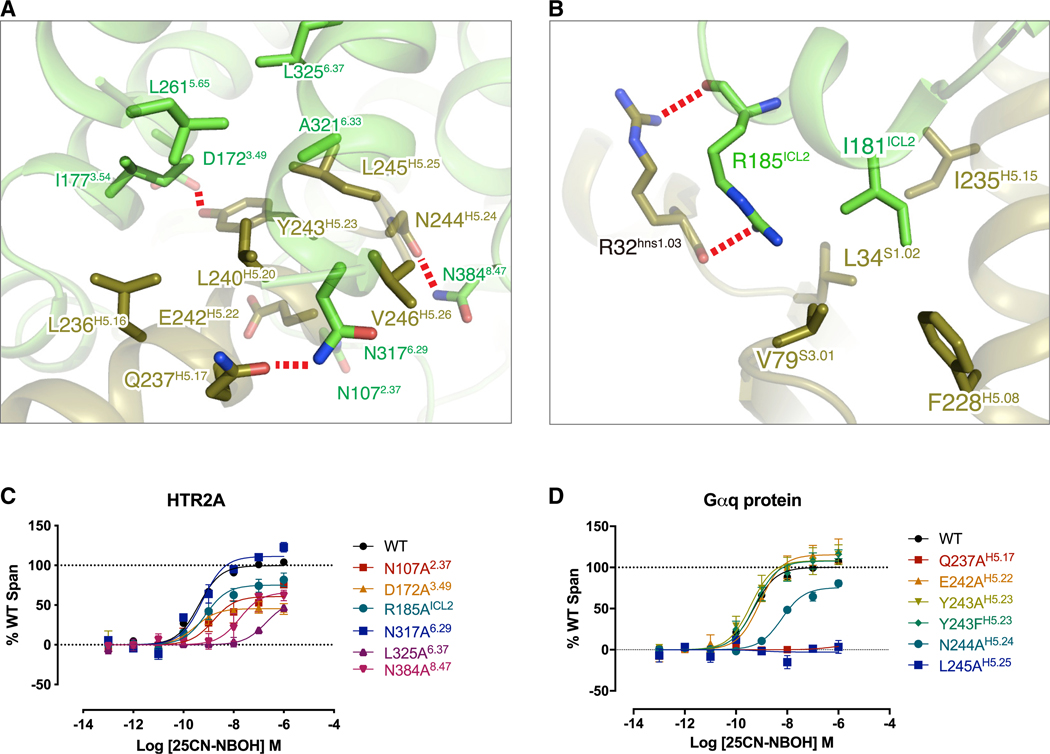
Figure 5. The Interface between the HTR2A and Gαq Protein and Confirmation of Its Functional Relevance.
(A) The close up view of interaction of HTR2A (green color) and H5 helix (olive color) of Gαq protein. All residues involved in interaction show stick model. Hydrogen bond interactions are highlighted by the red dashed line.
(B) The detailed view of interaction of ICL2 of HTR2A and Gαq and showing I181ICL2 of HTR2A and its surrounded hydrophobic residues of Gαq.
(C) BRET validation of residues in the HTR2A interface. See Table S7 for fitted parameter values.
(D) BRET validation of residues in the Gαq interface. See Table S7 for fitted parameter values where data represent mean ± SEM of n = 3 biological replicates.
See also Table S5.

