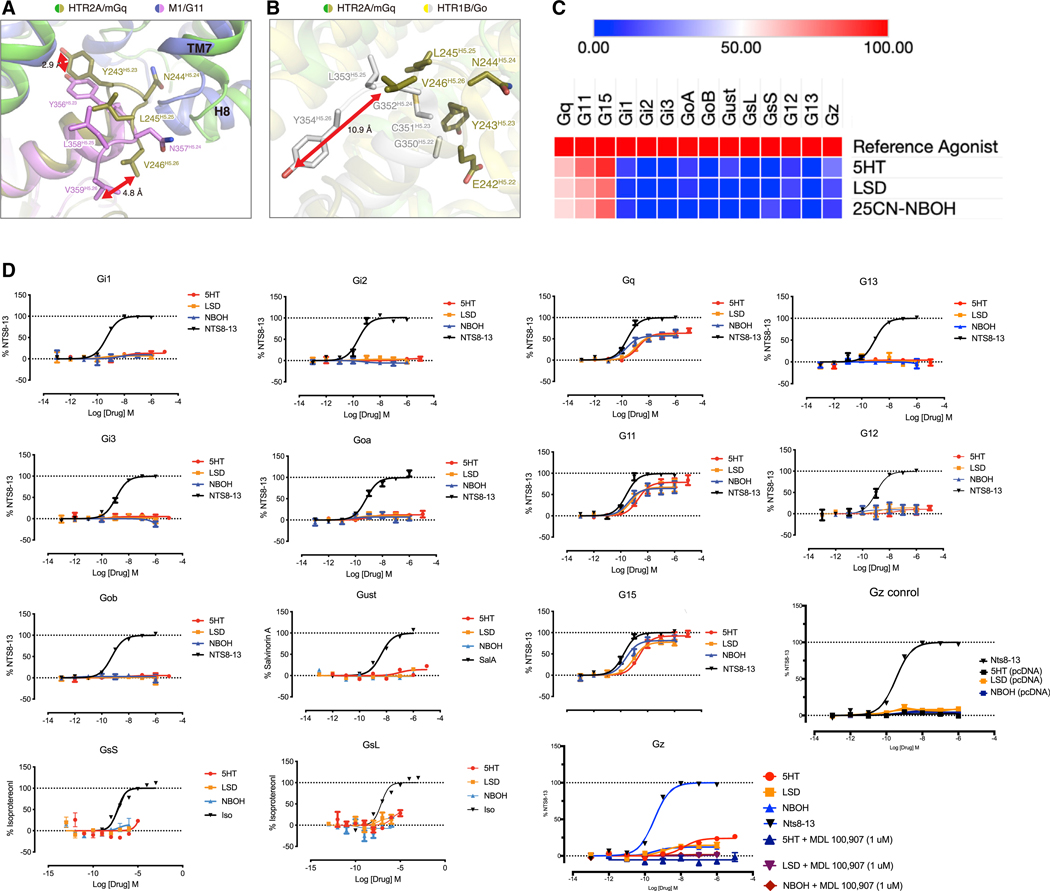
Figure 6. HTR2A Couples Efficiently to Gq-Family Members In Vitro.
(A)Shown is an alignment of the HTR2A-Gq (green and olive, respectively) and the M1-G11 (lavender and pink, respectively) interface at the tip of the α5 helix of the respective Gα subunits. As depicted, V359H5.26 unde rgoes a 4.8 Å shift in HTR2A compared with M1 while Y356H5.23 is shifted 2.9 Å relative to M1.
(B) Shows a comparison of HTR2A-Gq with the HTR1B-Go (yellow and gray, respectively) showing that the HTR2A Y354H5.26 cognate residue V246H5.26 is shifted up 10.9 Å.
(C) Shows a heatmap of the relative efficacy for selected agonists at HTR2A versus a reference agonist for 14 distinct Gα subunits.
(D)Shows concentration-response curves (N = 3 biological replicates each) for the 14 Gα subunits in 7C along with controls for the Gz study.
See also Table S7.

