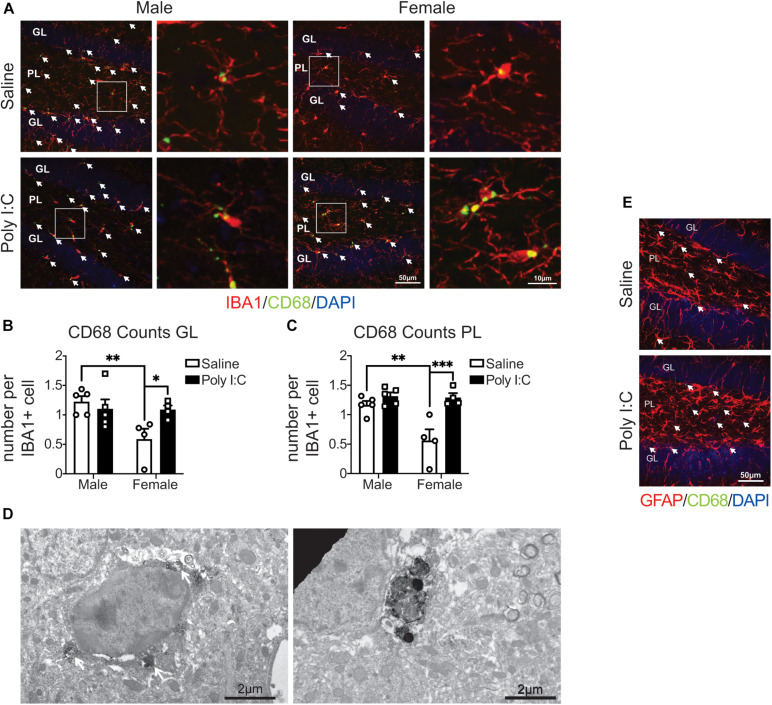
FIGURE 1.
Male (left); female (right); saline (black outlined white bars with black outlined circles); poly I:C (black bars with black outline squares). n = 4–5 animals/group. ∗p < 0.05; ∗∗p < 0.01; ∗∗∗p < 0.001. CD68 levels were increased in IBA1+ microglia in the hippocampal DG of female mice exposed to maternal poly I:C. (A) Representative images (20x) (left of each pair) and 5x magnified pictures (100x) (right of each pair) of IBA1+ microglia containing CD68 puncta from each condition (left half: males, right half: females; saline: top, poly I:C: bottom). Each image was from the DG and includes the granule cell layer (GL) and polymorphic layer (PL). IBA1+ microglia are shown in red, CD68 puncta in green and DAPI stained nuclei in blue. Scale bar = 50 μm (20x) and 10 μm (100x). (B) CD68 puncta counts per IBA1+ microglia in the GL. There was an increase in CD68 counts in female offspring exposed to poly I:C [interaction: F(1, 14) = 5.41, p = 0.04; p = 0.05], but not male offspring (p > 0.99). There were less microglial CD68 puncta in females than males from saline exposed dams (p = 0.009), but not poly I:C exposed dams (p > 0.99). There was also a main effect of sex [F(1, 14) = 5.88, p = 0.03] with males having greater CD68 counts in total; but not between saline and poly I:C [F(1, 14) = 2.02, p = 0.18]. (C) CD68 counts per IBA1+ microglia in the PL. As with the GL, there was an increase in CD68 levels in females prenatally exposed to poly I:C [interaction: F(1, 14) = 7.99, p = 0.01; p = 0.0006], contrary to males (p > 0.99). Males whose dams were exposed to saline had greater CD68 levels than females (p = 0.002), but there were no sex differences in the poly I:C exposed offspring (p > 0.99). There was a main effect of sex [F(1, 14) = 9.14, p = 0.009], with males having greater CD68 counts overall, and of poly I:C administration also leading to greater CD68 puncta counts overall [F(1, 14) = 18.09, p = 0.0008]. (D) Representative electron micrograph (left) confirming the association of CD68 to lysosomes inside microglial cell bodies in mice exposed to mIA. White arrows indicate CD68 signal surrounding lysosomes and white asterisks represent CD68 signal adjacent to extracellular digestion. Scale bar = 2 μm. Representative electron micrograph (right) (6,800x) showing CD68 staining in a microglial process. Scale bar = 2 μm. (E) CD68 signal did not colocalize with GFAP+ astrocytes. Representative image from saline and poly I:C conditions. Each image was taken of the DG and included the GL and PL. GFAP+ astrocytes are show in red, CD68 puncta in green and indicated by white arrows, and DAPI stained nuclei in blue. Scale bar = 50 μm.

