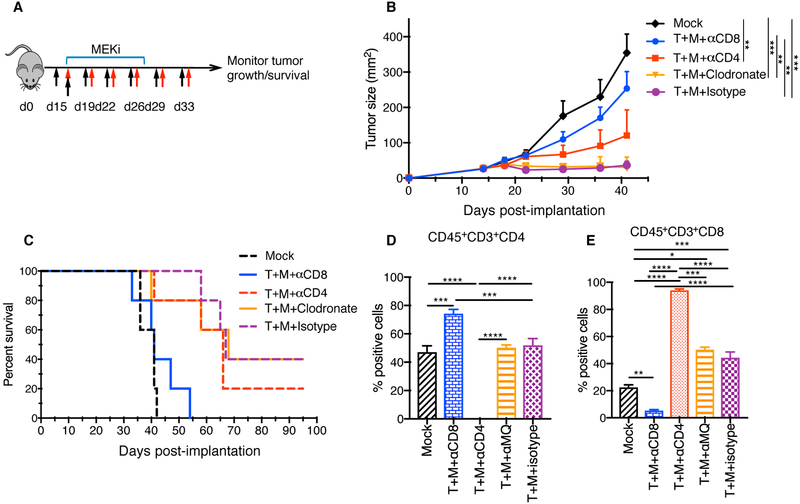
Figure 4. Depletion of CD8+ T cells abrogates the effects of T-VEC and MEKi combination therapy.
(A) C57BL/6J mice (n = 5/group) were implanted with D4M3A murine melanoma cells and mice were treated as indicated, described in methods. Red arrows indicate days of mT-VEC treatment, top blue bar indicated days of trametinib (MEKi) treatment, and black arrows indicating days where depletion antibodies against CD4, CD8 and clodronate were injected. (B) Mean tumor area of mice treated from different groups as indicated at day 40. (C) Survival of mice. (D-E) Flow cytometric analysis of tumor infiltrating T cells on day 24. (D) Bar graphs show the percentage CD45+CD3+CD4+ and (E) CD45+CD3+CD8+ cells. Each experiment was repeated at least twice with similar results. Data are presented as mean ± SEM and statistical differences between groups was measured by using one-way ANOVA. *p < 0.05, **p < 0.01, ***p < 0.001, ****p < 0.0001. Only significant differences are indicated.

