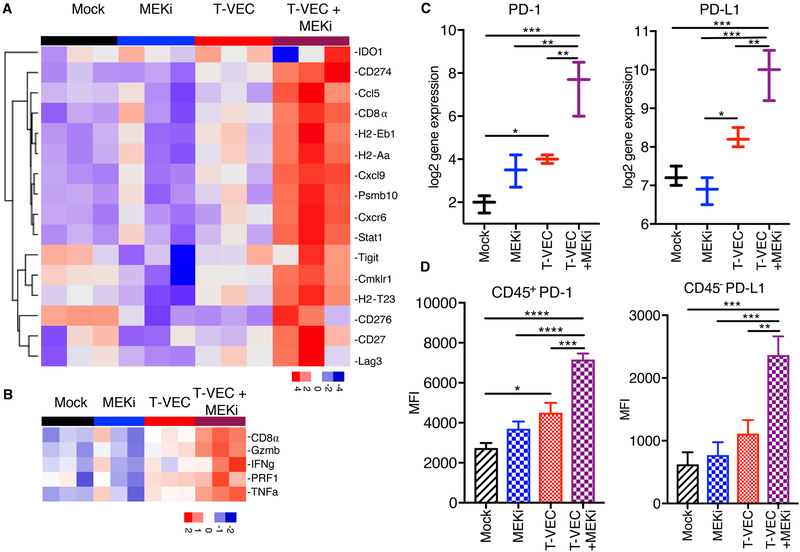
Figure 7. T-VEC and MEK inhibition reprograms immune silent tumors into immune inflamed tumors and induces expression of PD-1 and PD-L1.
C57BL/6J mice were implanted s.c. in the right flank with 3 × 10⁵ D4M3A cells and treated with mT-VEC (1 × 10⁶ pfu) i.t. for 3 doses on days 15, 19 and 22 and or trametinib (0.5 mg/kg) orally once daily on days 15–19. Tumors were harvested on day 24, total RNA was isolated and gene expression analysis performed using the NanoString PanCancer Immune panel as described in the Materials and Methods. (A) An inflammatory 16-gene expression profile was generated from mice (n=3) treated (as described in Fig 3D) with mock control (black), trametinib alone (MEKi; blue), mT-VEC alone (red), or combination mT-VEC and MEKi (purple). (B) A selected 5-gene expression signature represented by genes highly associated with CD8+ T cell activation. (C) Gene expression of PD-1 (right panel) and PD-L1 (left panel). (D) Bar graphs show the mean fluorescence intensity (MFI) of CD45+PD-1+ (left panel) and CD45-PD-L1+ (right panel). Each experiment was performed at least twice with similar results. Data are presented as mean ± SEM and the statistical differences between groups were measured by two-tailed student t test. *p < 0.05, **p < 0.01, ***p < 0.001, ****p < 0.0001.

