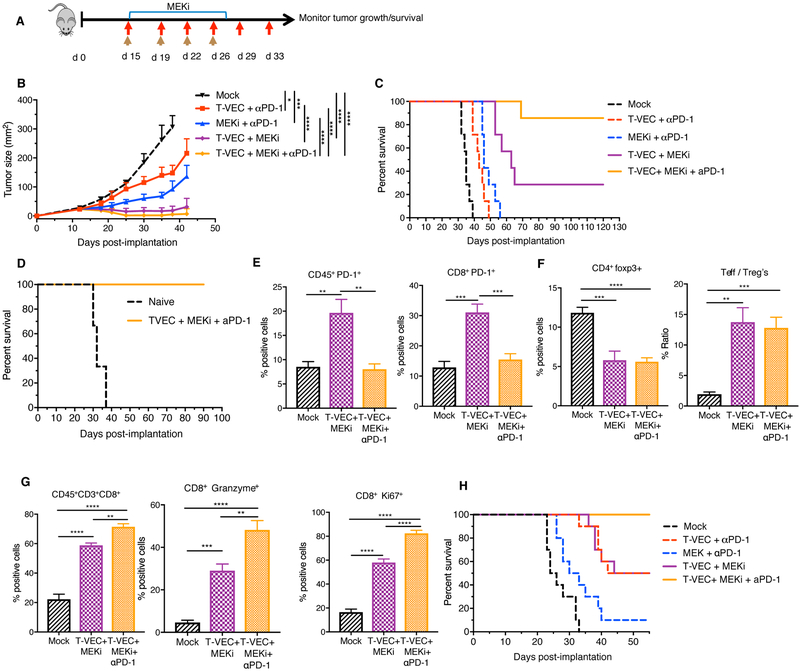
Figure 8. Triple combination treatment with T-VEC, MEK inhibition and PD-1 blockade improves therapeutic treatment of melanoma and colon cancer models.
(A) Treatment schema: red arrows indicate T-VEC, top blue bar indicates trametinib and brown arrows indicate αPD-1. (B) Mean tumor area. (C) Survival of mice. (D) Re-challenge of mice cured from B. (E-F) Flow cytometry of tumors at day 24. Bar graph indicating percent positive (E) CD45+PD-1+ cells (right panel) and CD45+CD8+PD-1+ cells (left panel), (F) CD4+FoxP3+ (right panel) and ratio of effector T cells to Tregs (left panel (G) CD8+ T cells, granzyme B+ CD8 T cells, and Ki67+ CD8 T cells respectively. (H) Evaluation of triple combination in CT26 murine colon carcinoma model. Mice were treated as described in Materials and Methods. Each experiment was conducted at least twice with similar results. Data are presented as mean ± SEM and statistical differences between groups were measured by two-tailed student t test. *p < 0.05, **p < 0.01, ***p < 0.001, ****p < 0.0001.

