
Figure 1. CBX2 Drives the LLPS of CBX-PRC1.
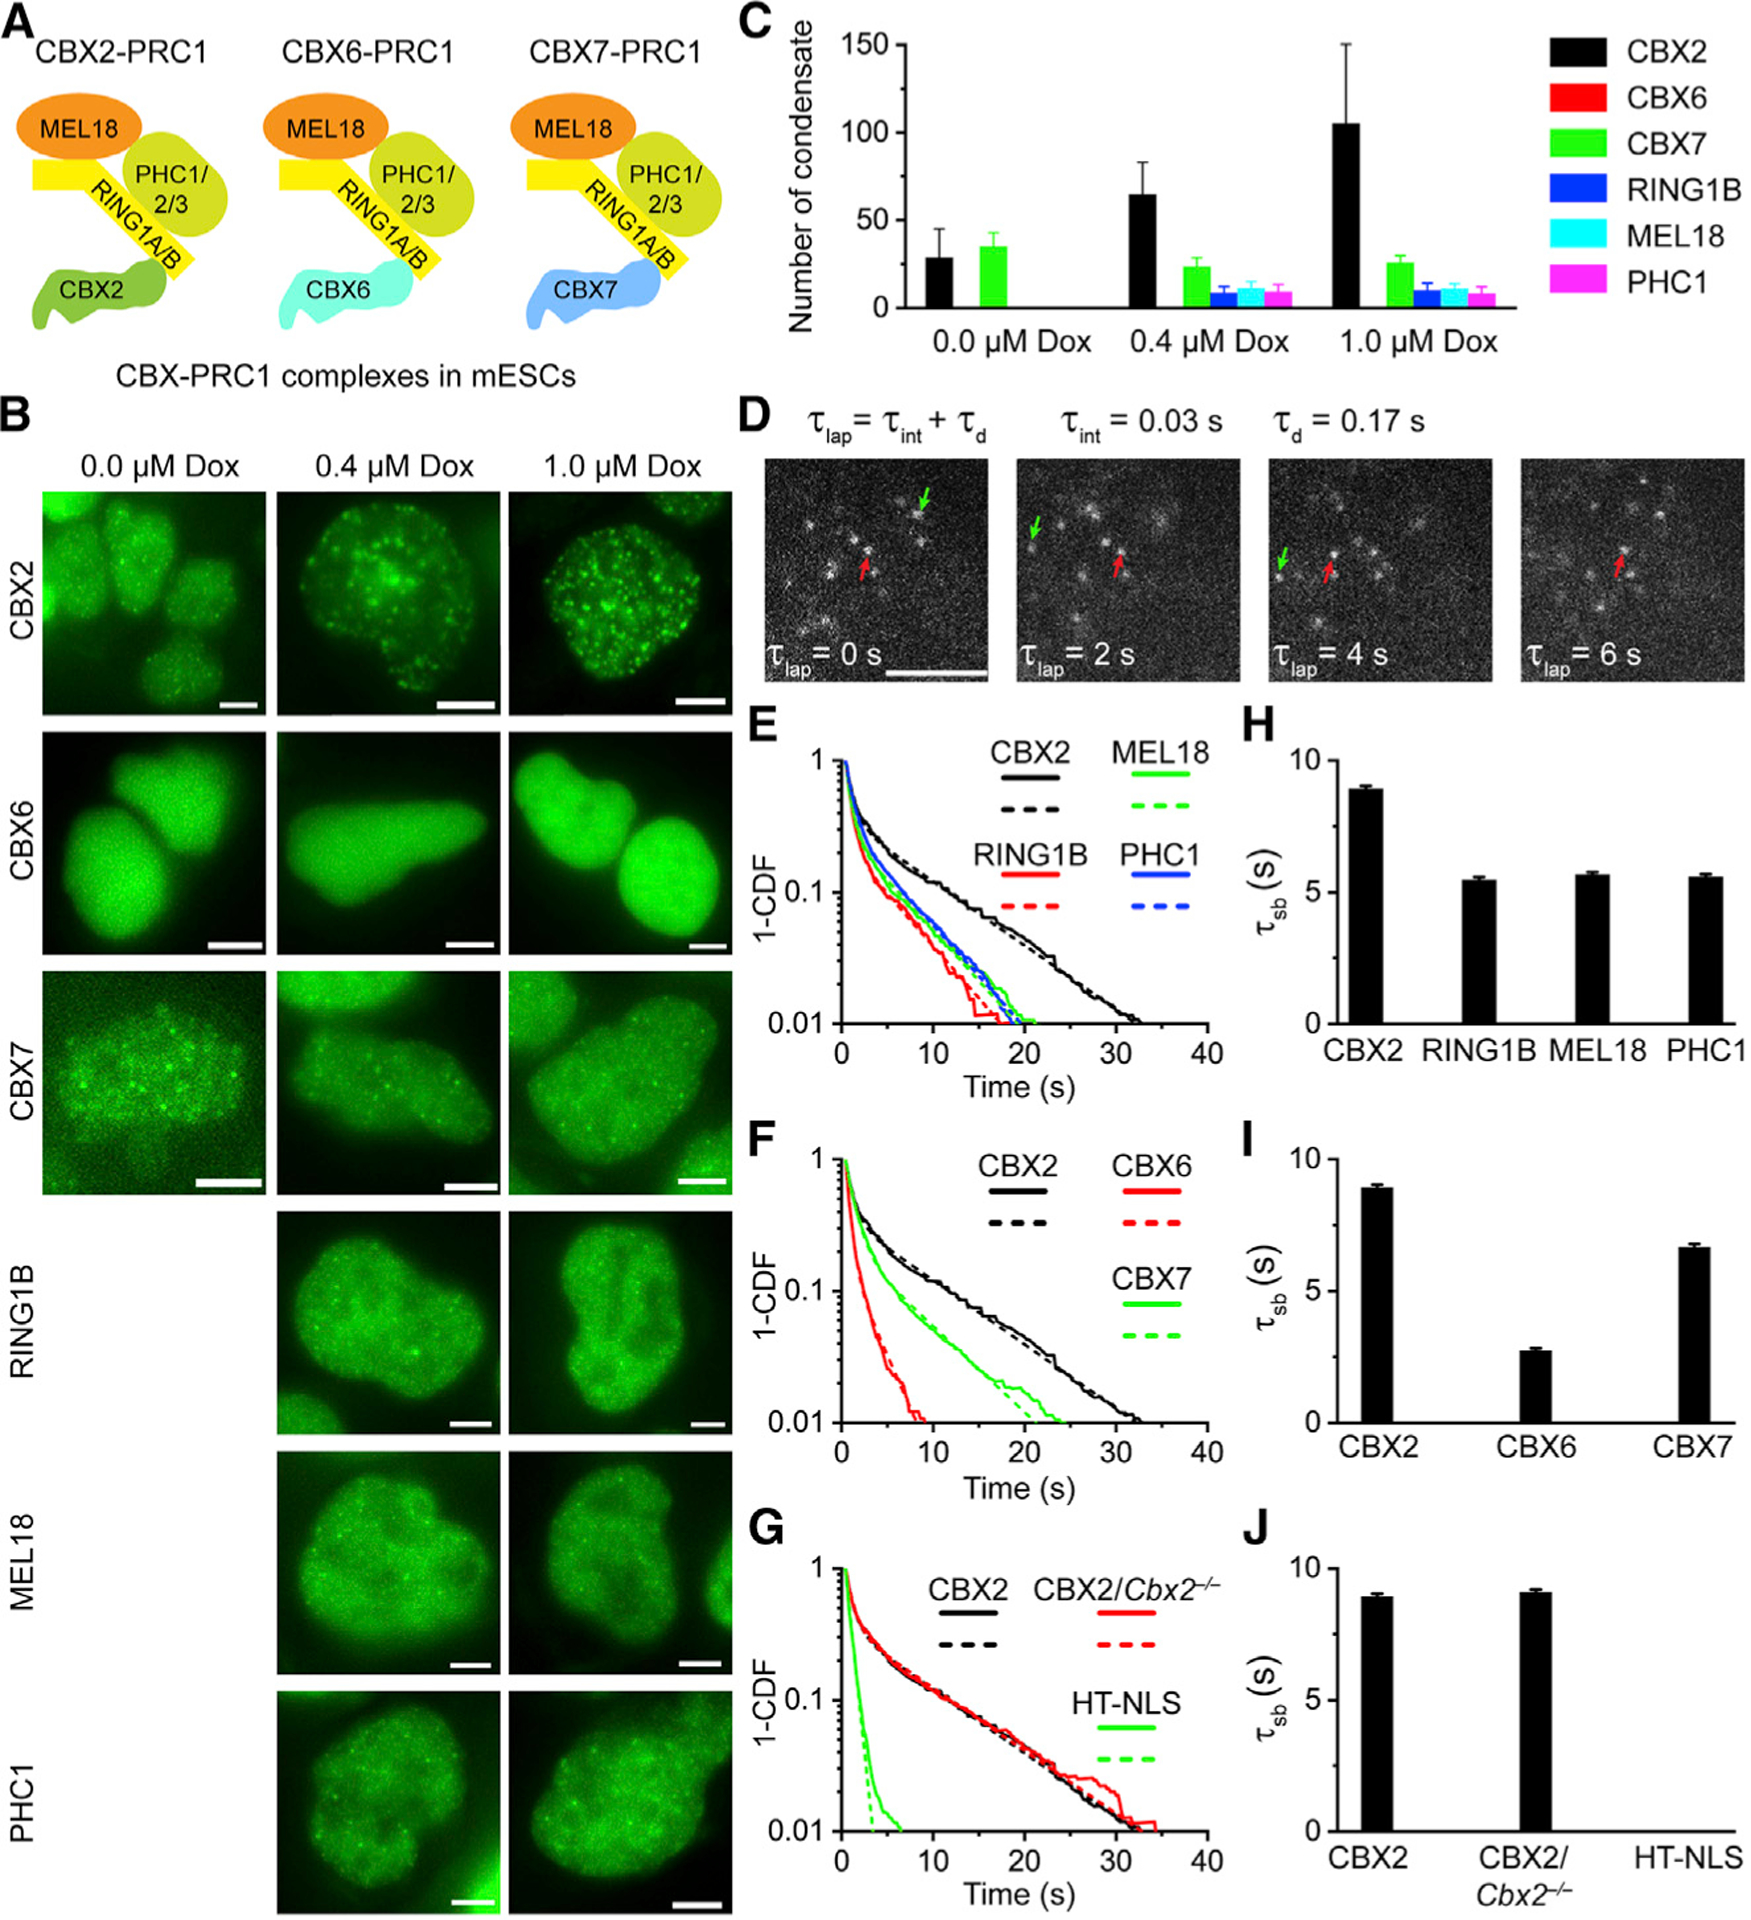
(A) CBX-PRC1 complexes in mESCs.
(B) Example fluorescence images for CBX-PRC1 proteins fused with HaloTag in mESCs. Scale bar, 5.0 μm.
(C) Numbers of condensates of HaloTag-PRC1 fusion proteins quantified from (B). Error bars represent SD.
(D) Measuring residence times by live-cell single-molecule tracking. The red arrowhead indicates molecules that bind stably to chromatin (τsb), and the green arrowhead represents molecules that bind transiently to chromatin (τtb). Scale bar, 2.0 μm.
(E–G) Survival probability distribution of the dwell times. HT-NLS, HaloTag fused with nuclear localization sequence. The numbers of cells and trajectories used are listed in Table S1.
(H–J) Specific residence times (τsb) quantified from (E)–(G). Non-specific residence times (τtb) are shown in Figure S1. Error bars represent standard error for the derived parameter.