
Figure 5. The Target-Search Process of CBX2 and Its Variants.
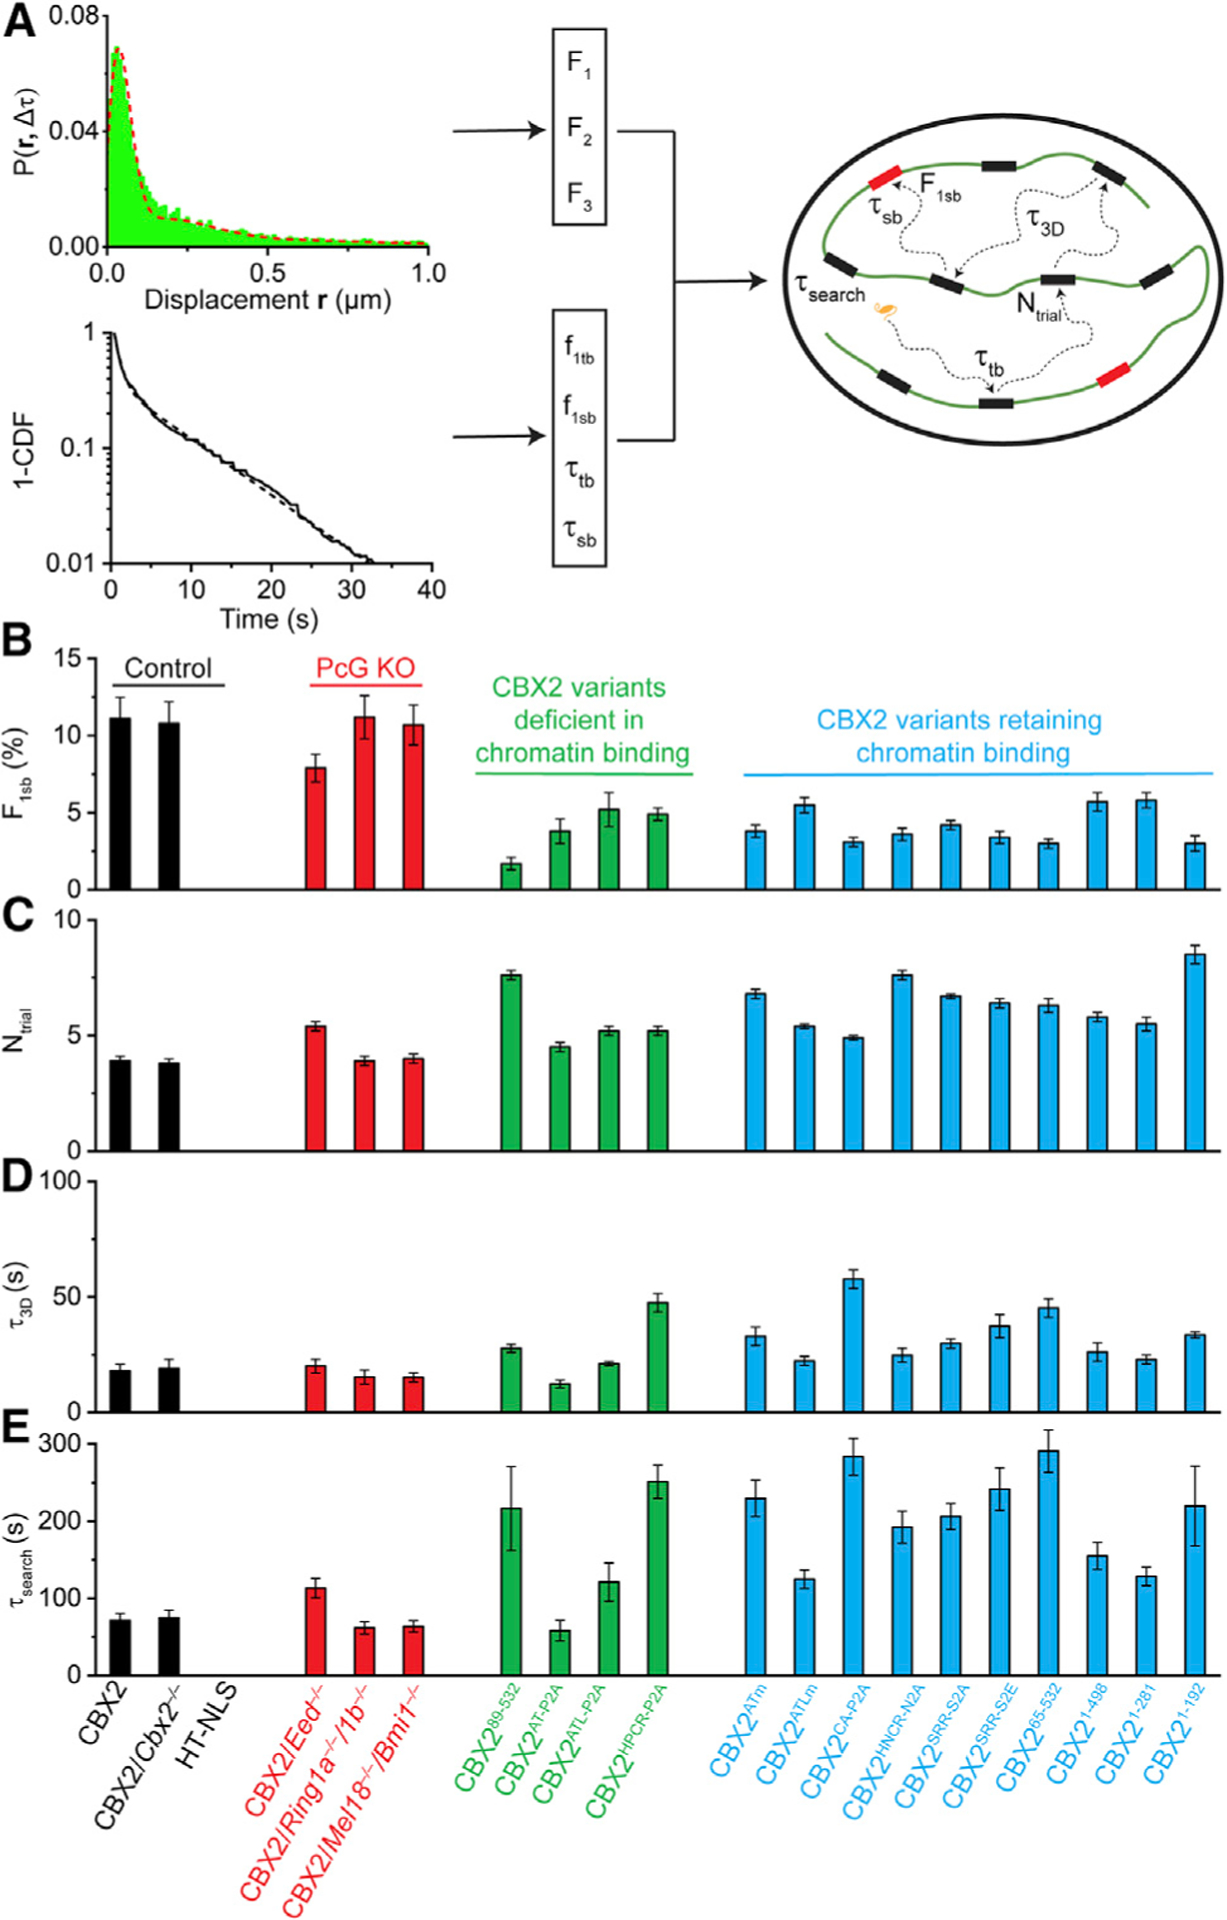
(A) Schematic representation of the quantification of the target-search process. See STAR Methods for details.
(B–E) F1sb (B), Ntrial (C), τ3D (D), and τsearch (E) for CBX2 and its variants in wild-type mESCs and for CBX2 in PcG-knockout mESCs as well as for the control HT-NLS in wild-type mESCs. Displacement histograms are in Figure S5. The numbers of cells and displacements used are listed in Table S1. Error bars represent SD.