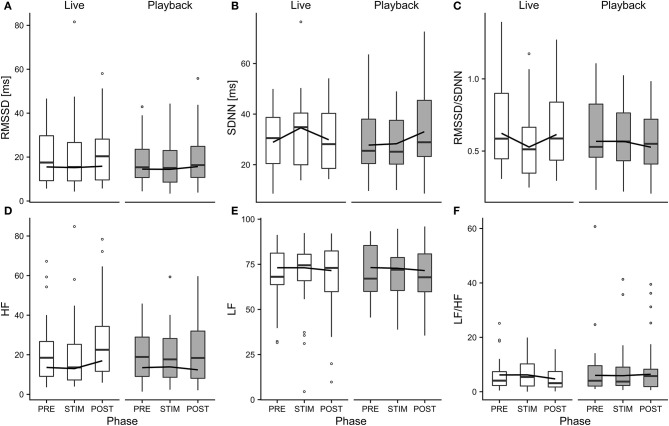
Figure 4.
Means of heart rate variability parameters RMSSD (A), SDNN (B), RMSSD/SDNN (C), HF (D), LF (E), and LF/HF (F) of heifers (n = 26), calculated across the three trials per treatment and depicted according to treatment (white = “live,” gray = “playback”) and phase (PRE = pre-stimulus, STIM = stimulus, POST = post-stimulus). The black line indicates the estimated means of the models. Statistics for LMMs: significant interaction of condition and phase for SDNN (B), RMSSD/SDNN (C), HF (D), p < 0.05.

