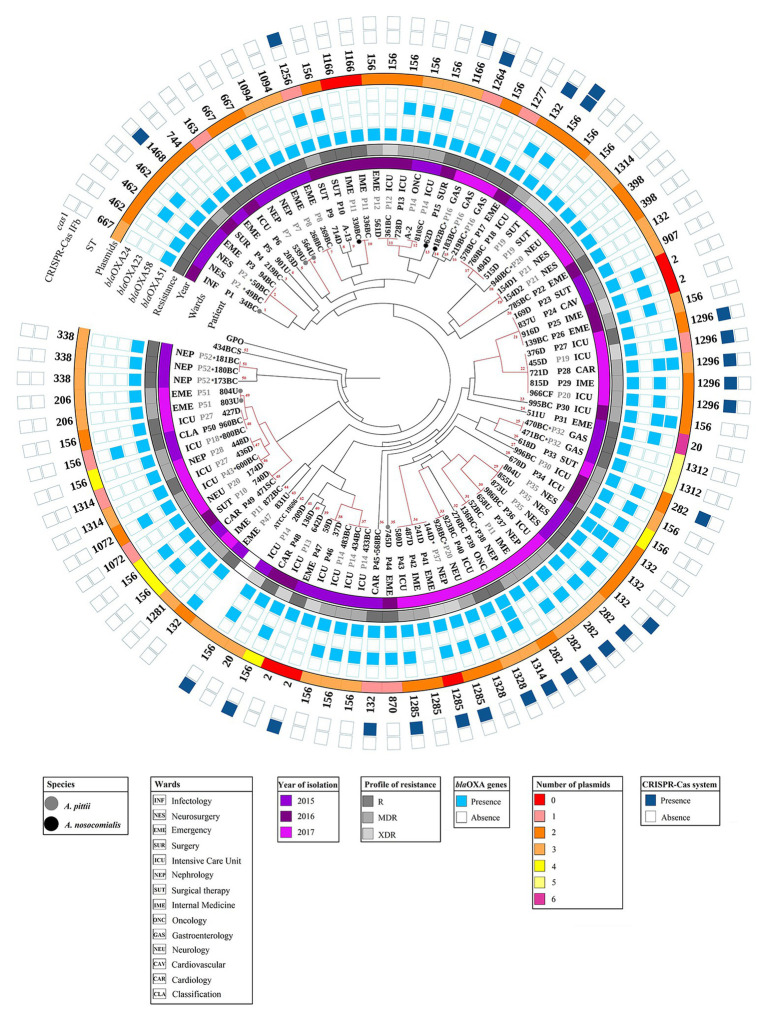
Figure 3.
Dendrogram profile of the A. baumannii, A. pittii, and A. nosocomialis complex strains. Dendrogram profile displaying the genetic relatedness among the 88 strains based on the pulsed-field gel electrophoresis (PFGE) pattern. The red line represents the strains with the same pulsotype. The species other than A. baumannii are shown with circles in gray (A. pittii) and black (A. nosocomialis). Internal data represent strain with the origin of isolation, followed by the patient and the ward of origin for each strain. The asterisk symbol shows the strains associated with HAIs (bacteremia and pneumonia). The first band represents the year of isolation, and the second represents the profile of resistance: Resistant (R), multidrug-resistant (MDR), and extensively drug-resistant (XDR). The strains with a R profile showed resistance to PIP, SAM, or TZP. The detection of blaoxa genes is represented by clear blue clear squares and the amplification of the CRISPR-Cas system with dark blue squares. The number of plasmids associated with each strain is shown in the third band. The type sequences (ST) for each strain were added. The color codes for each analyzed characteristic are shown in the legends below the figure. The visualization was performed with the iTol program (Letunic and Bork, 2007).

