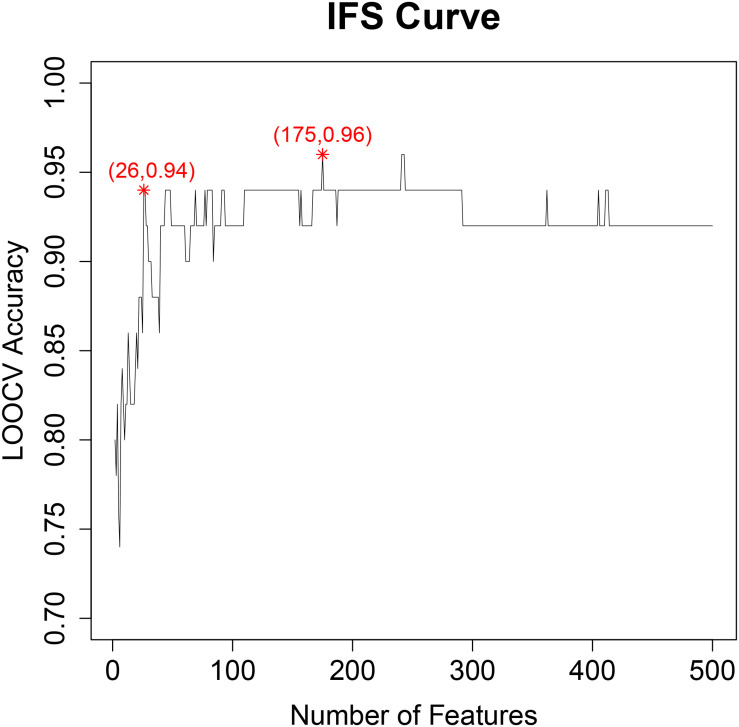
FIGURE 1.
The IFS curve for final key feature selection. The X-axis was the number of features. The Y-axis was their prediction accuracy evaluated with LOOCV. When 175 genes were used, the accuracy was the highest, at 0.96. But when only 26 genes were used, the accuracy became 0.94. Balancing both model complexity and performance, we chose the 26 genes as the final key features and their SVM predictor as the optimized predictor for perineural invasion.

