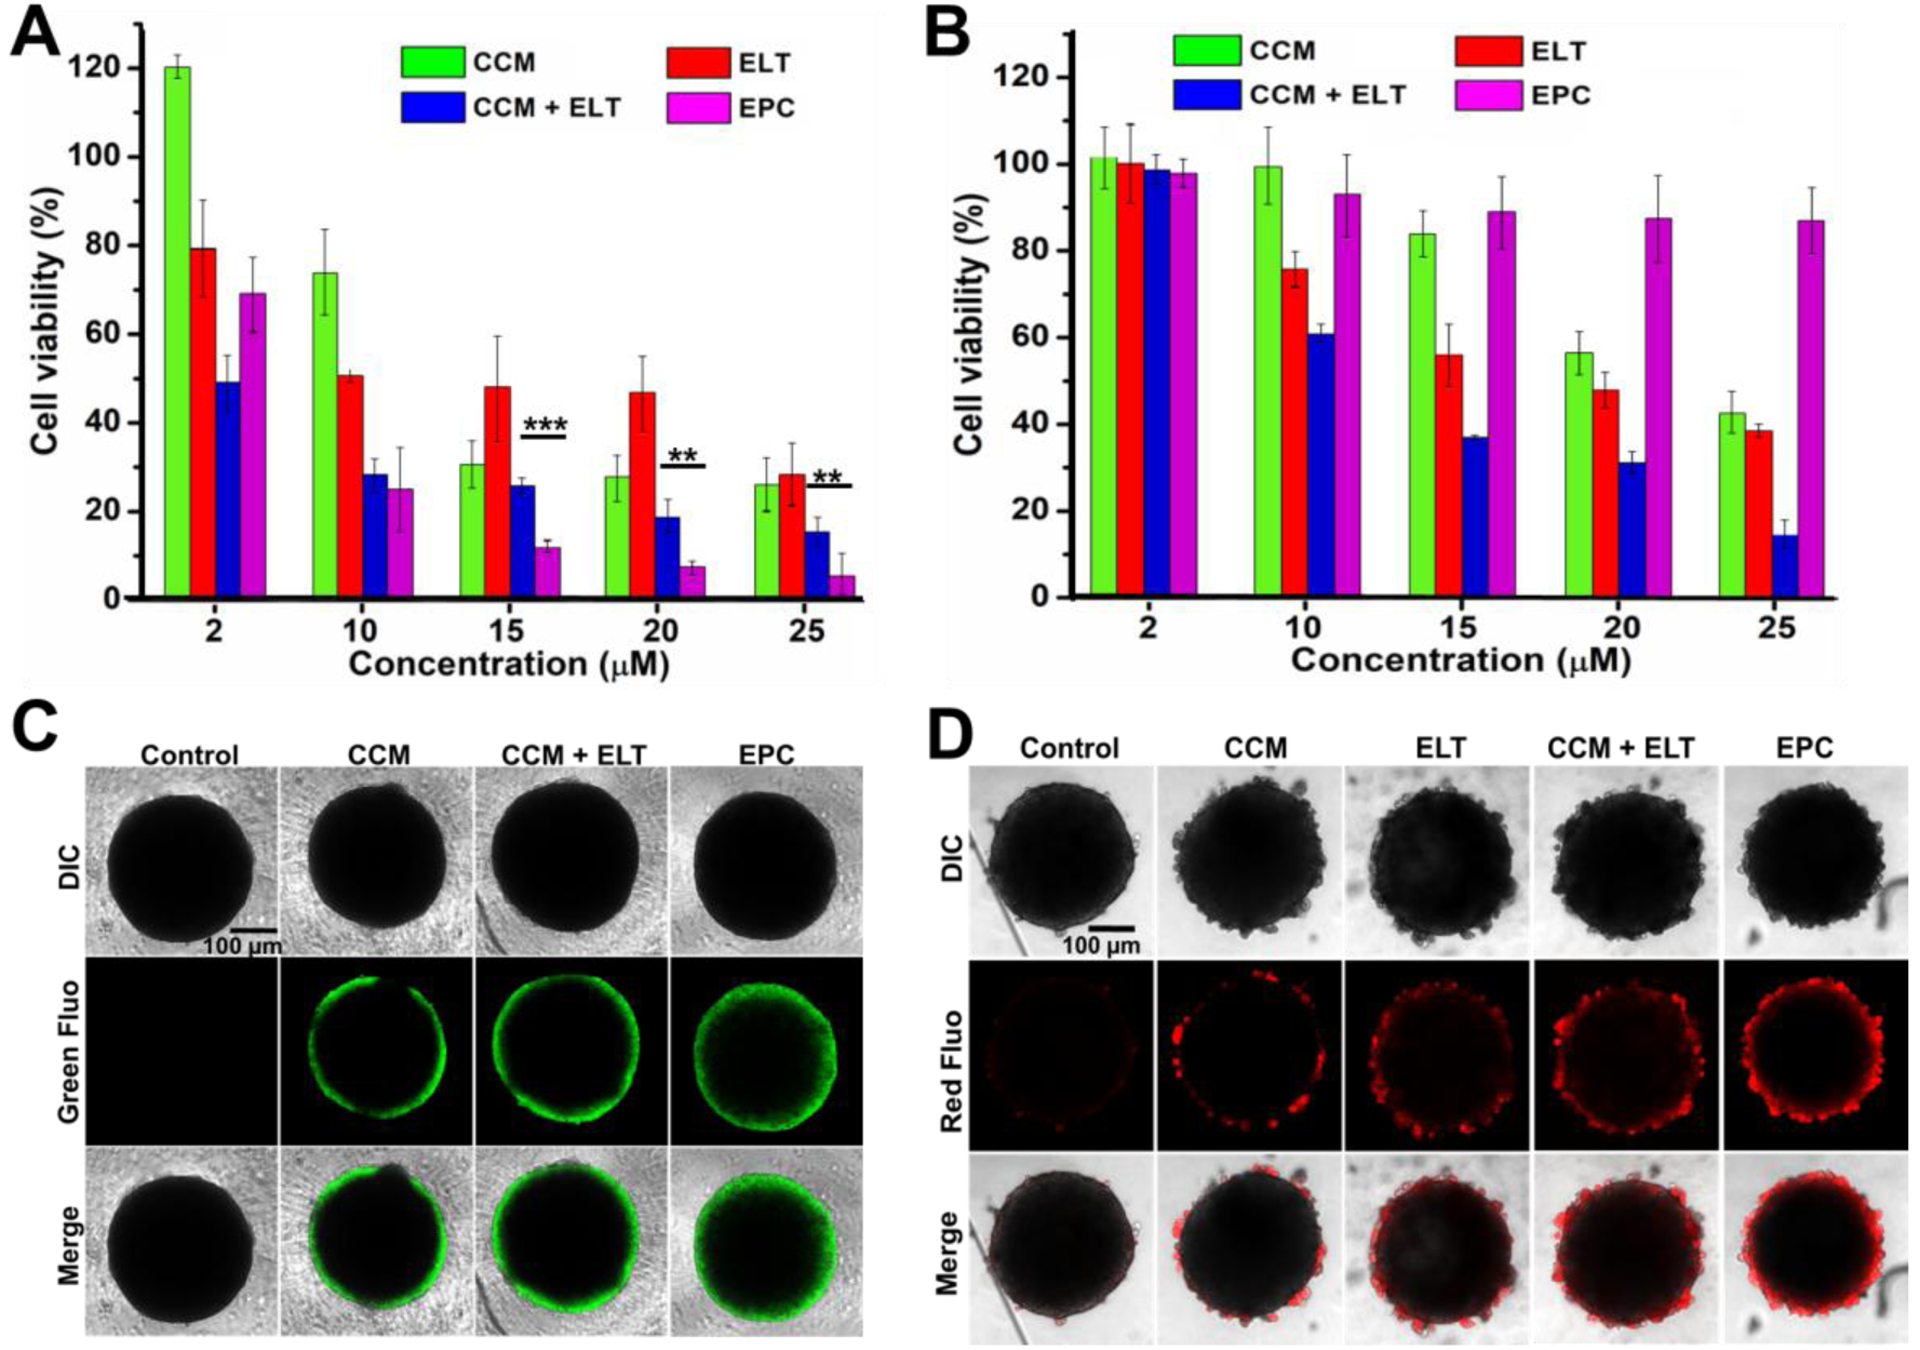
Figure 3.

Cytotoxicity of CCM and EPC in 2D and 3D culture. Cell viability of BxPC-3 cells (A) and NIH-3T3 cells (B) after receiving various treatments in 96 well plate 2D culture for 24 h. n = 3, **P < 0.01 and ***P < 0.001. Fluorescence images of drug penetration (C) and cell killing effect (D) in BxPC-3 tumor spheroids. Green fluorescence signal of CCM and EPC in (C), and red fluorescence signal propidium iodide staining for dead cell in (D). Scale bars in (C) and (D) are 100 μm.
