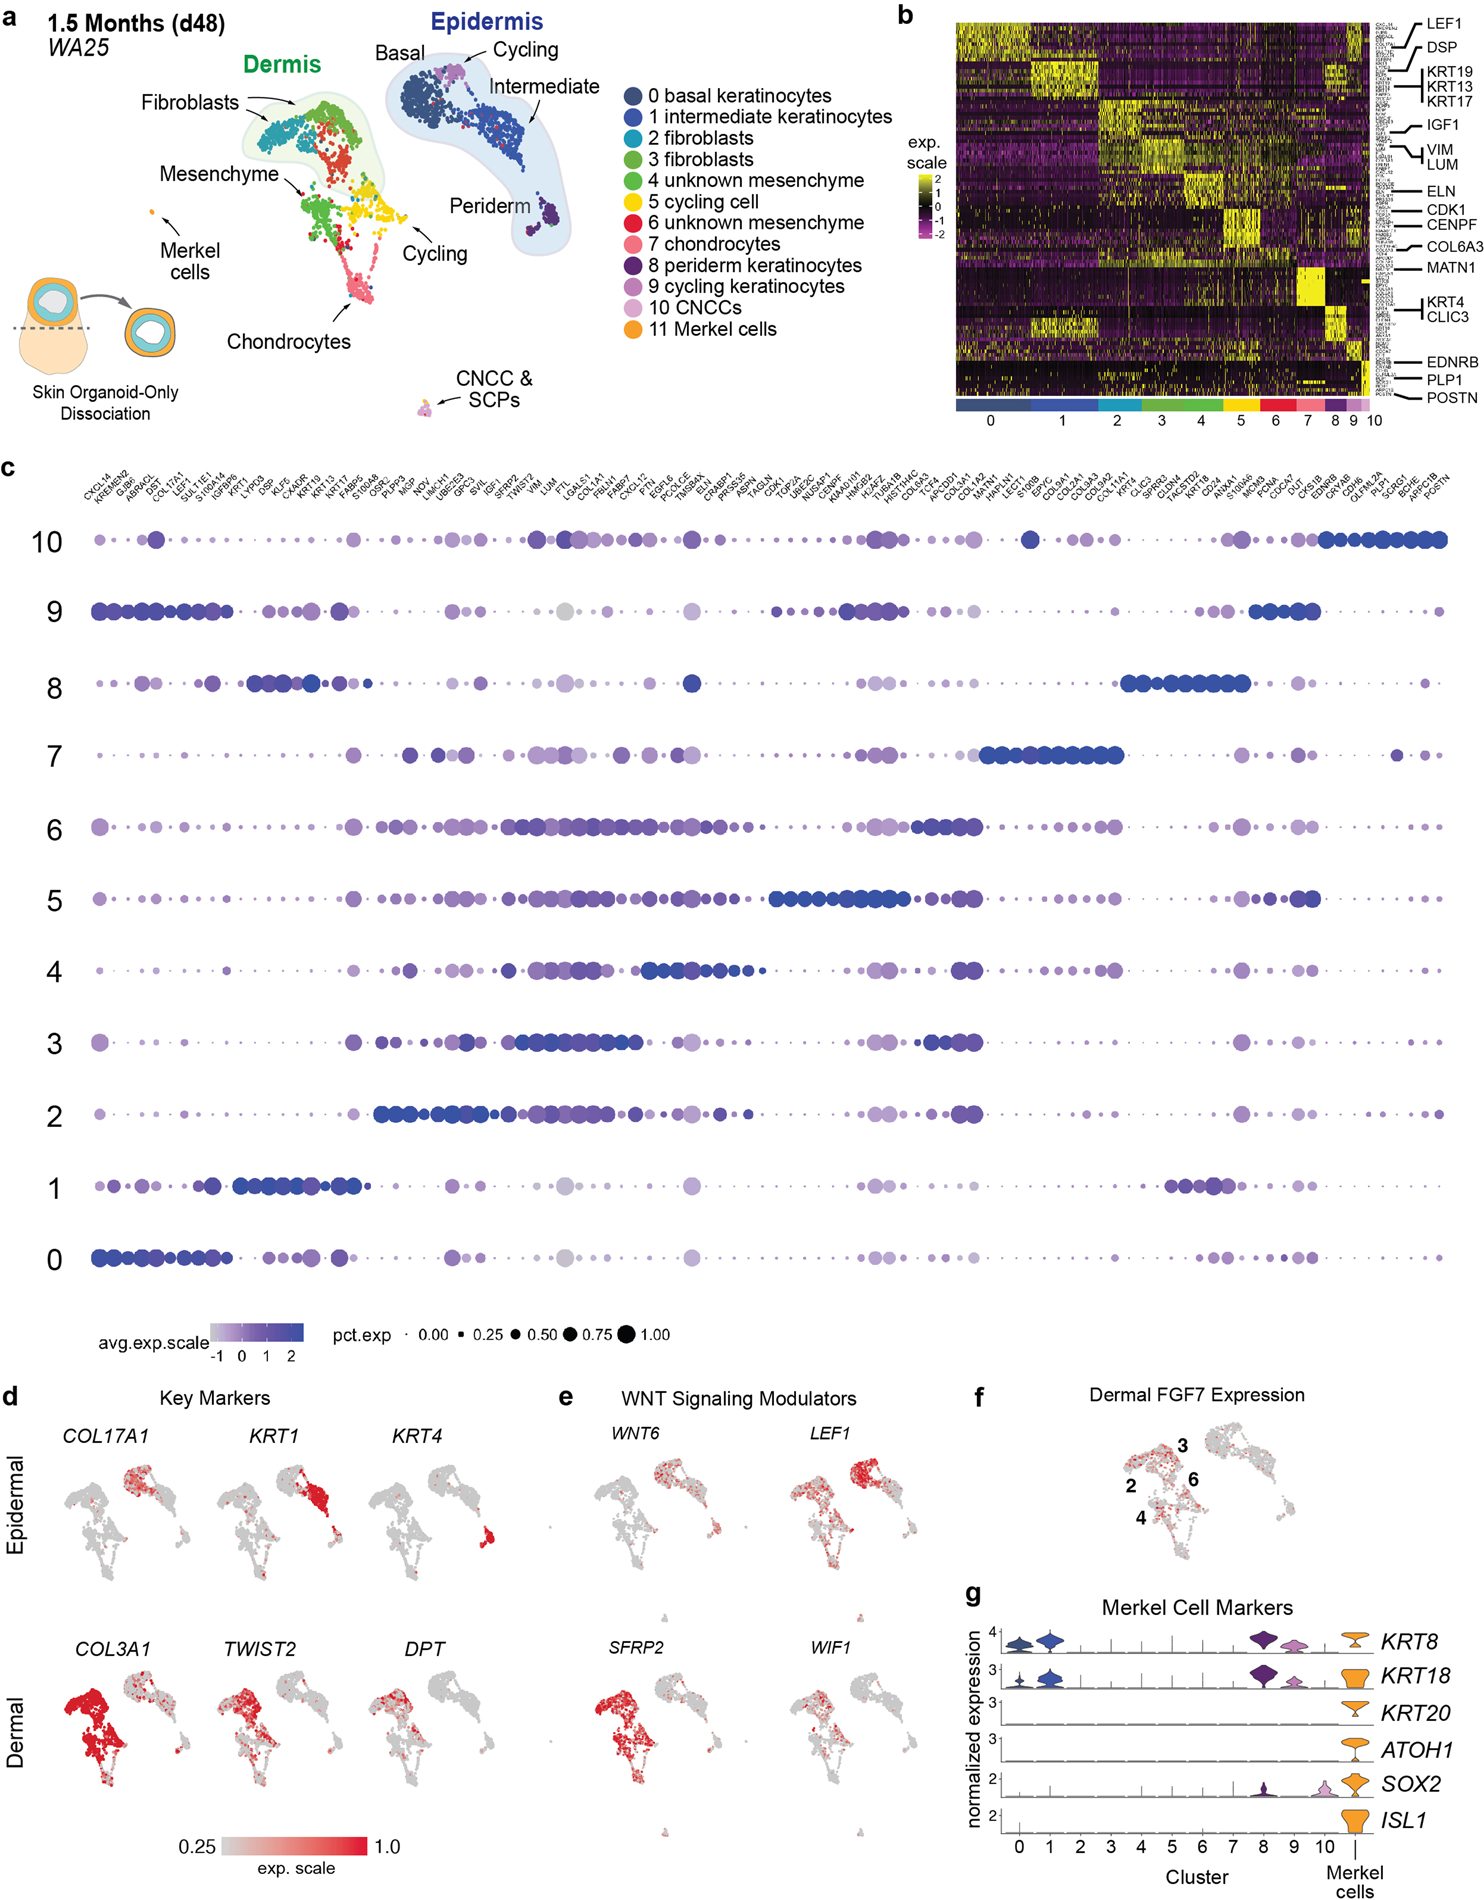
Extended Data Figure 6 |. Single-cell RNA-seq analysis of day-48 skin organoids derived from WA25 cells.

a, UMAP clustering of day-48 WA25 cell subtypes. Colours indicate cell state. n = 2491 cells. Six day-48 skin organoids from one experiment were pooled for scRNA-seq analysis. b, Heatmap displaying the scaled LogNormalize (ln)-expression of the top 10 differentially expressed genes per cell cluster for the day-48 WA25 scRNA-Seq dataset. c, Dot plot array displaying the top 10 positively expressed genes per cell cluster for the day-48 WA25 scRNA-Seq dataset. Gene expression frequency is indicated by spot size and expression level is indicated by colour intensity. d, UMAP plots for cell subtype specific marker genes. e, UMAP plots for WNT signalling pathway genes. Note that WNT6 is expressed in basal keratinocytes and peridermal keratinocytes. LEF1 expression appears localized to basal keratinocytes. Negative WNT modulatory genes, SFRP2 and WIF1, are expressed in putative dermal fibroblasts of the mesenchymal cell group. f, Dermal fibroblast clusters also contain cells expressing FGF7 (also known as Keratinocyte Growth Factor). The numbers of cell clusters with positive expression are listed on the UMAP plot. g, Merkel cell identification: Using the UMAP clustering algorithm, we identified a subset (n = 8 cells) of cluster (C)-0 cells (putative basal keratinocytes) that were completely separated from the majority of C-0 cells, suggesting that our unbiased analysis pipeline failed to identify a unique subset of low-abundance cells. We used the Seurat manual selection tool to generate an 11th cluster containing these cells (see left side of panel “a”). Violin plots show normalized gene expression of the Merkel cell marker genes ATOH1, ISL1, SOX2, KRT8, KRT18, and KRT20.
