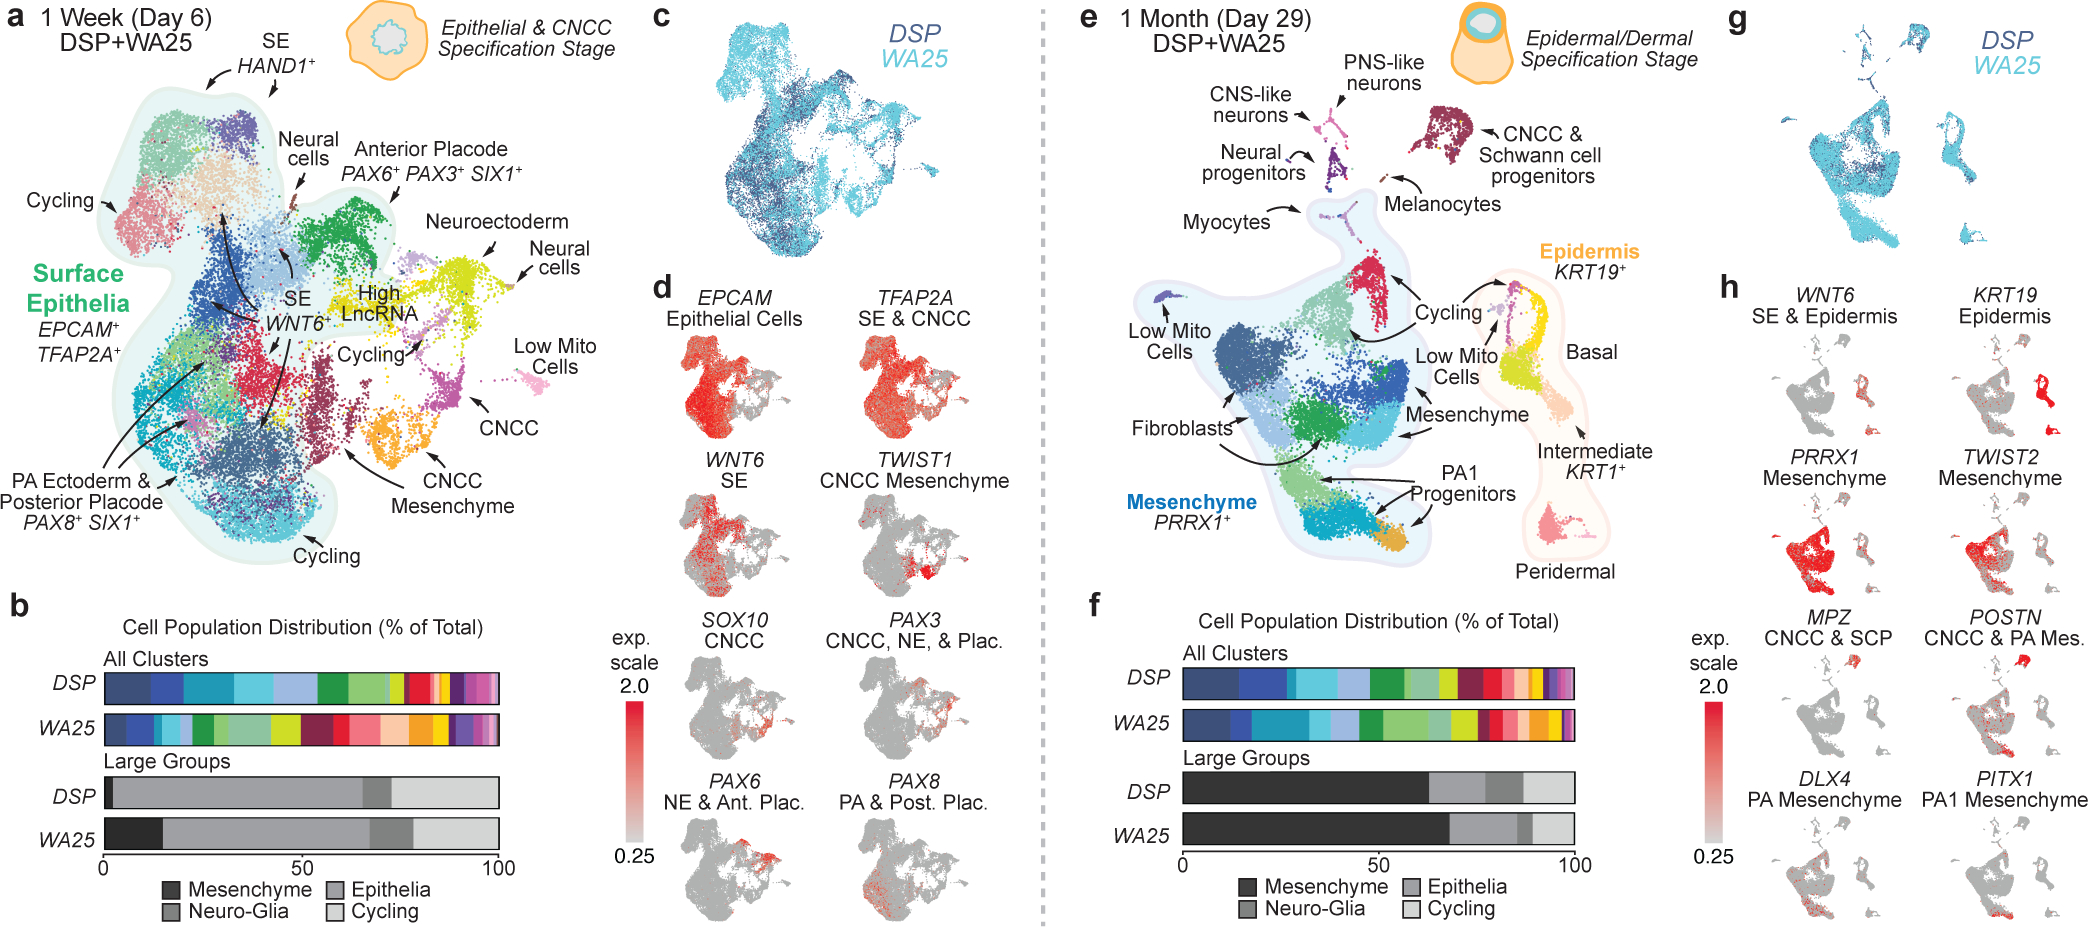
Figure 2 |. Single-cell RNA-sequencing reveals gene expression signatures of craniofacial skin development.

a, e, Uniform manifold approximation projections (UMAP) of day-6 and day-29 WA25 and DSP-GFP integrated datasets. Data represent (a) 23,239 cells and (e) 18,190 cells. The major cell cluster groupings of surface epithelia, epidermis, and mesenchyme and presumptive cell identities, based on a priori knowledge, are noted. b, f, Percentage distribution of all cell clusters (color-coded to match panels a and e) and large groups consisting of mesenchymal, epithelial, neuro-glial, and cycling cells. c, g, Overlay UMAP plots comparing cells from DSP-GFP and WA25 datasets. d, h, Key gene markers for cell subtype classification and determination of anterior-posterior patterning. Clusters with no discernable identity had either low mitochondrial or high long non-coding RNA gene expression and are labeled “Low Mito Cells” and “High LncRNA”, respectively. Abbr: pharyngeal arch (PA).
