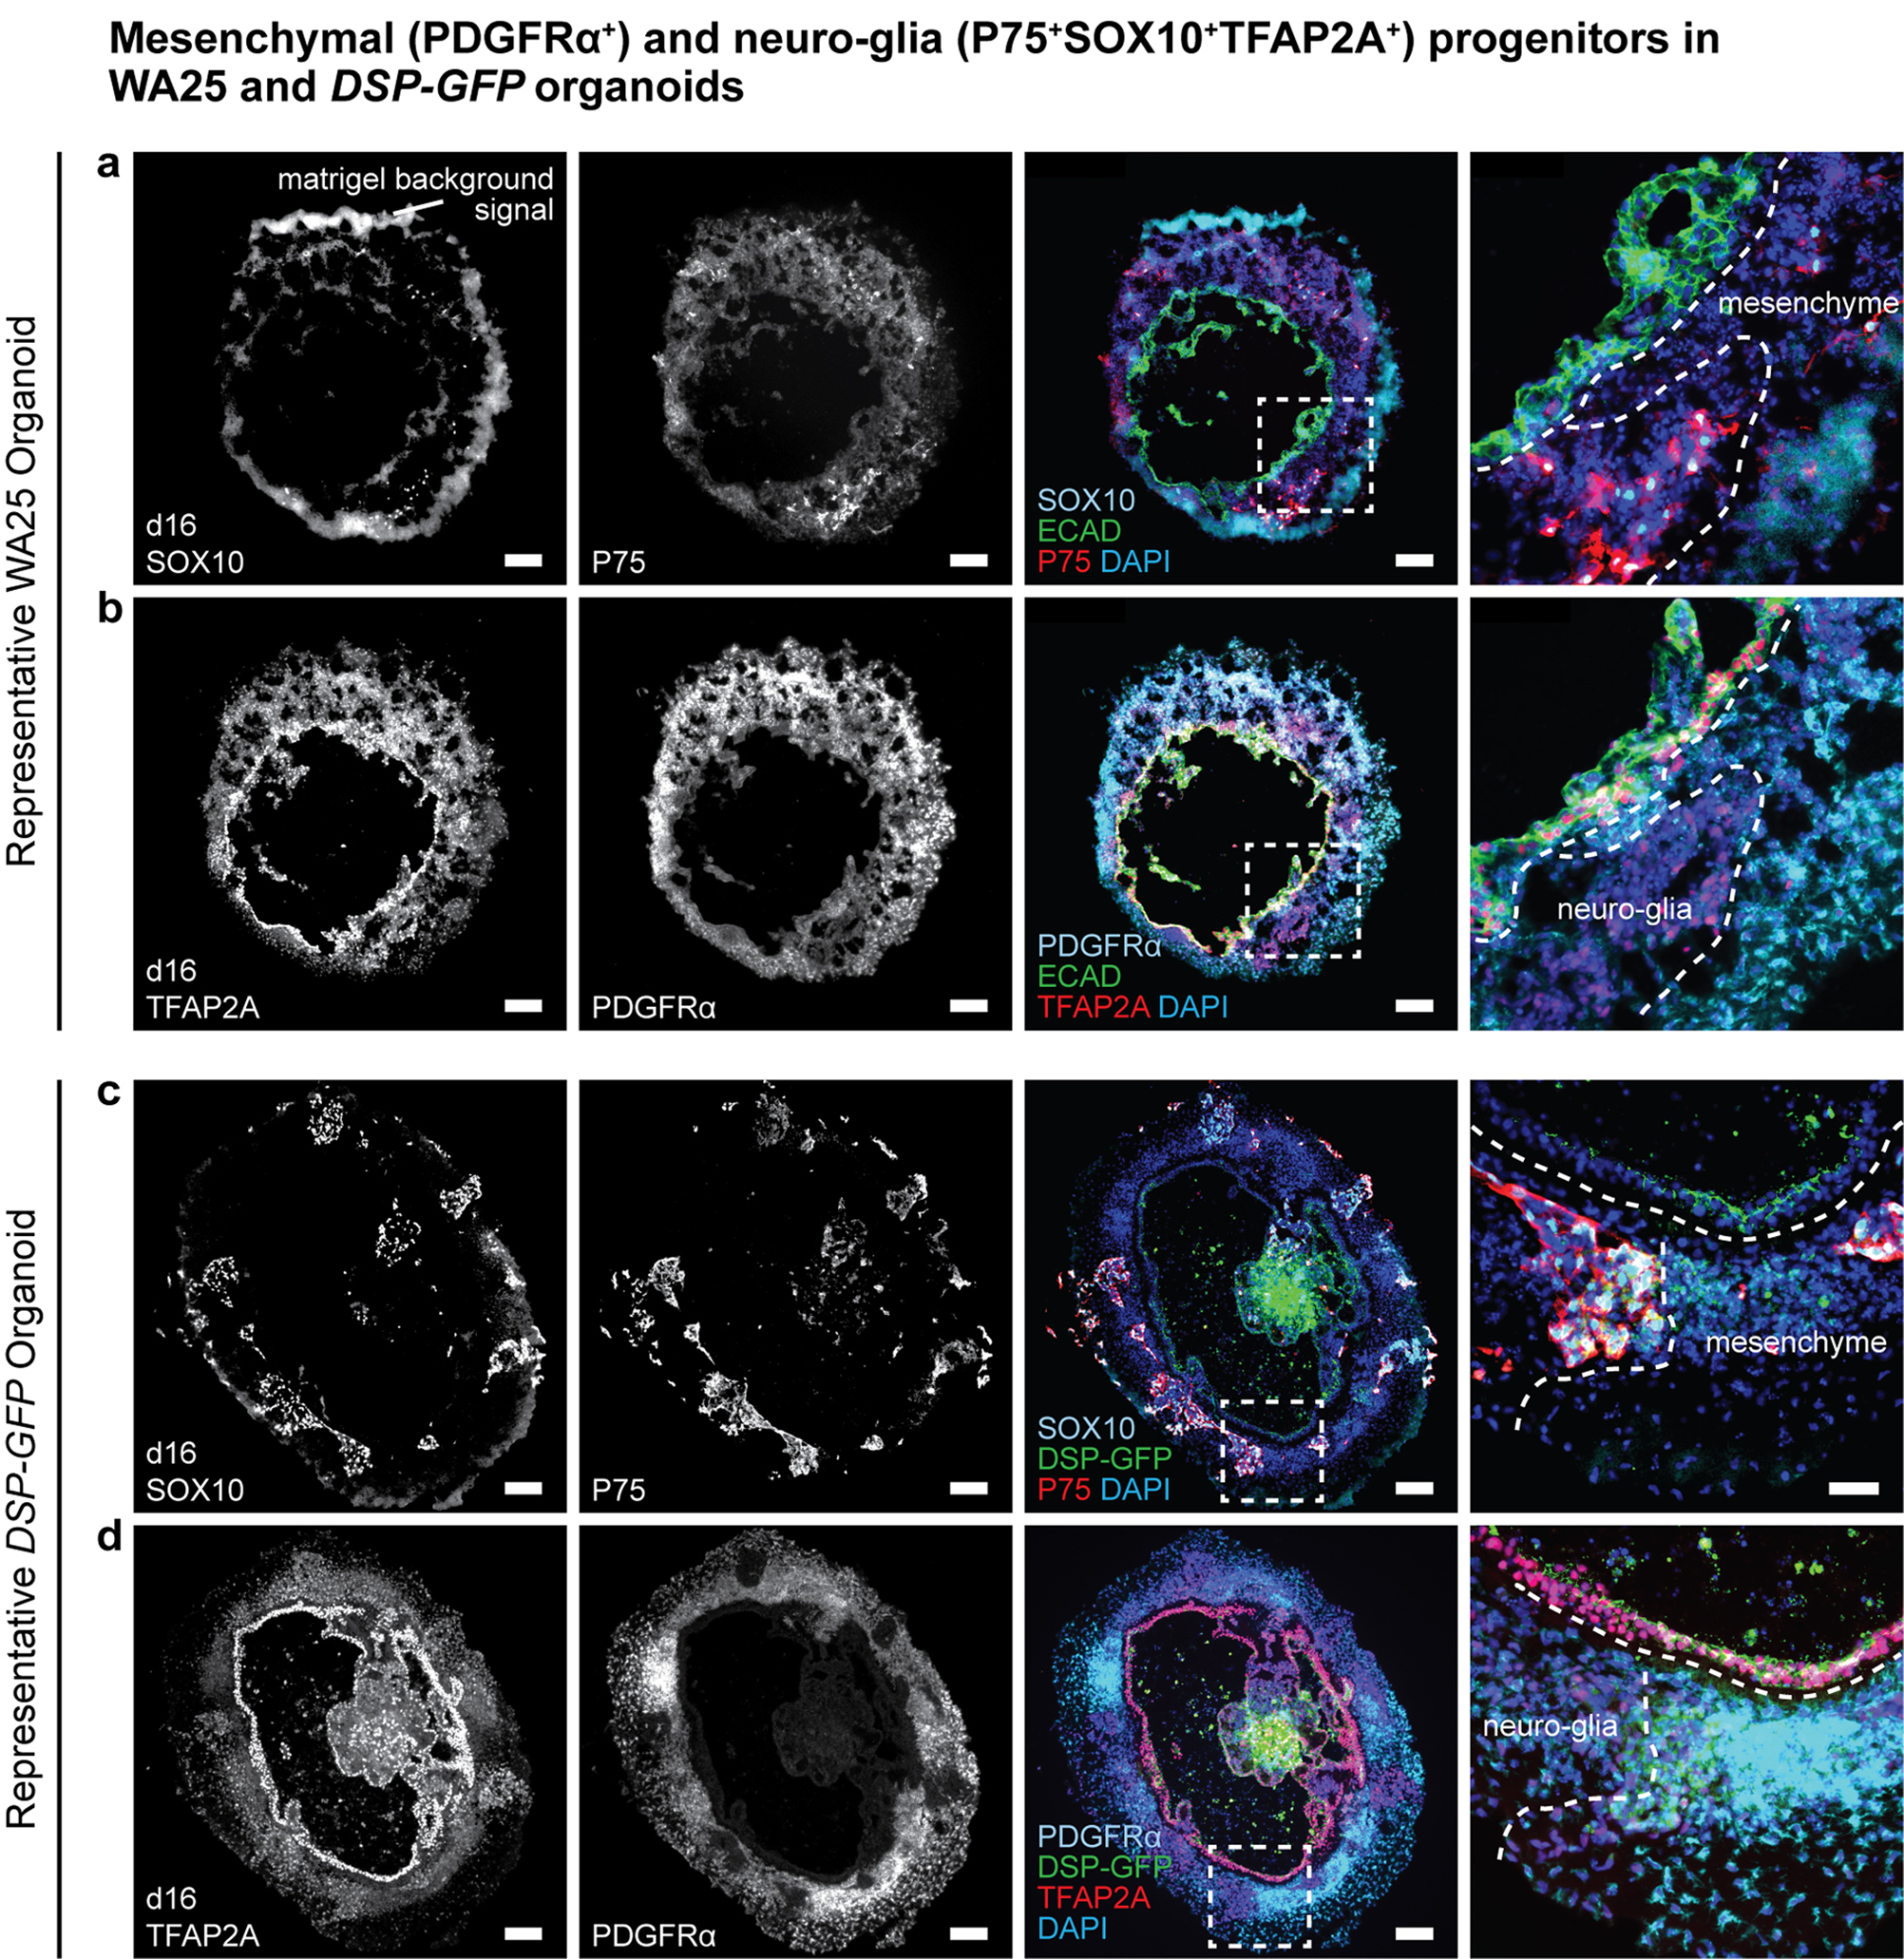
Extended Data Figure 2 |. Surface ectoderm and CNCC induction in WA25 and DSP-GFP skin organoid cultures.

a-d, Representative immunostaining images of day-16 (a, b) WA25 and (c, d) DSP-GFP aggregates with co-induced epithelium and CNCCs under optimized d0BSF-d3LF treatment culture. P75 and SOX10 highlight neuro-glial-associated CNCCs, and PDGFRα and TFAP2A highlight mesenchyme-associated CNCCs. (a, b) Epithelium is highlighted by ECAD and TFAP2A double-positive signals. (c, d) ECAD was omitted to allow observation of the endogenous DSP-GFP signal at the apical surface of the epithelium. Dashed boxes indicate magnified regions presented in the right-end panels. Dashed lines outline the borders between the epithelium and CNCCs and between neuro-glial- and mesenchyme-associated CNCCs. Note that there are nonspecific fluorescence background noise signals from Matrigel. Immunostaining was repeated three times independently on a total 9 aggregates from 3 separate experiments. Scale bars: 100 μm (a-d), 50 μm (magnified panels). Corresponds with concepts/data in Fig. 1c.
