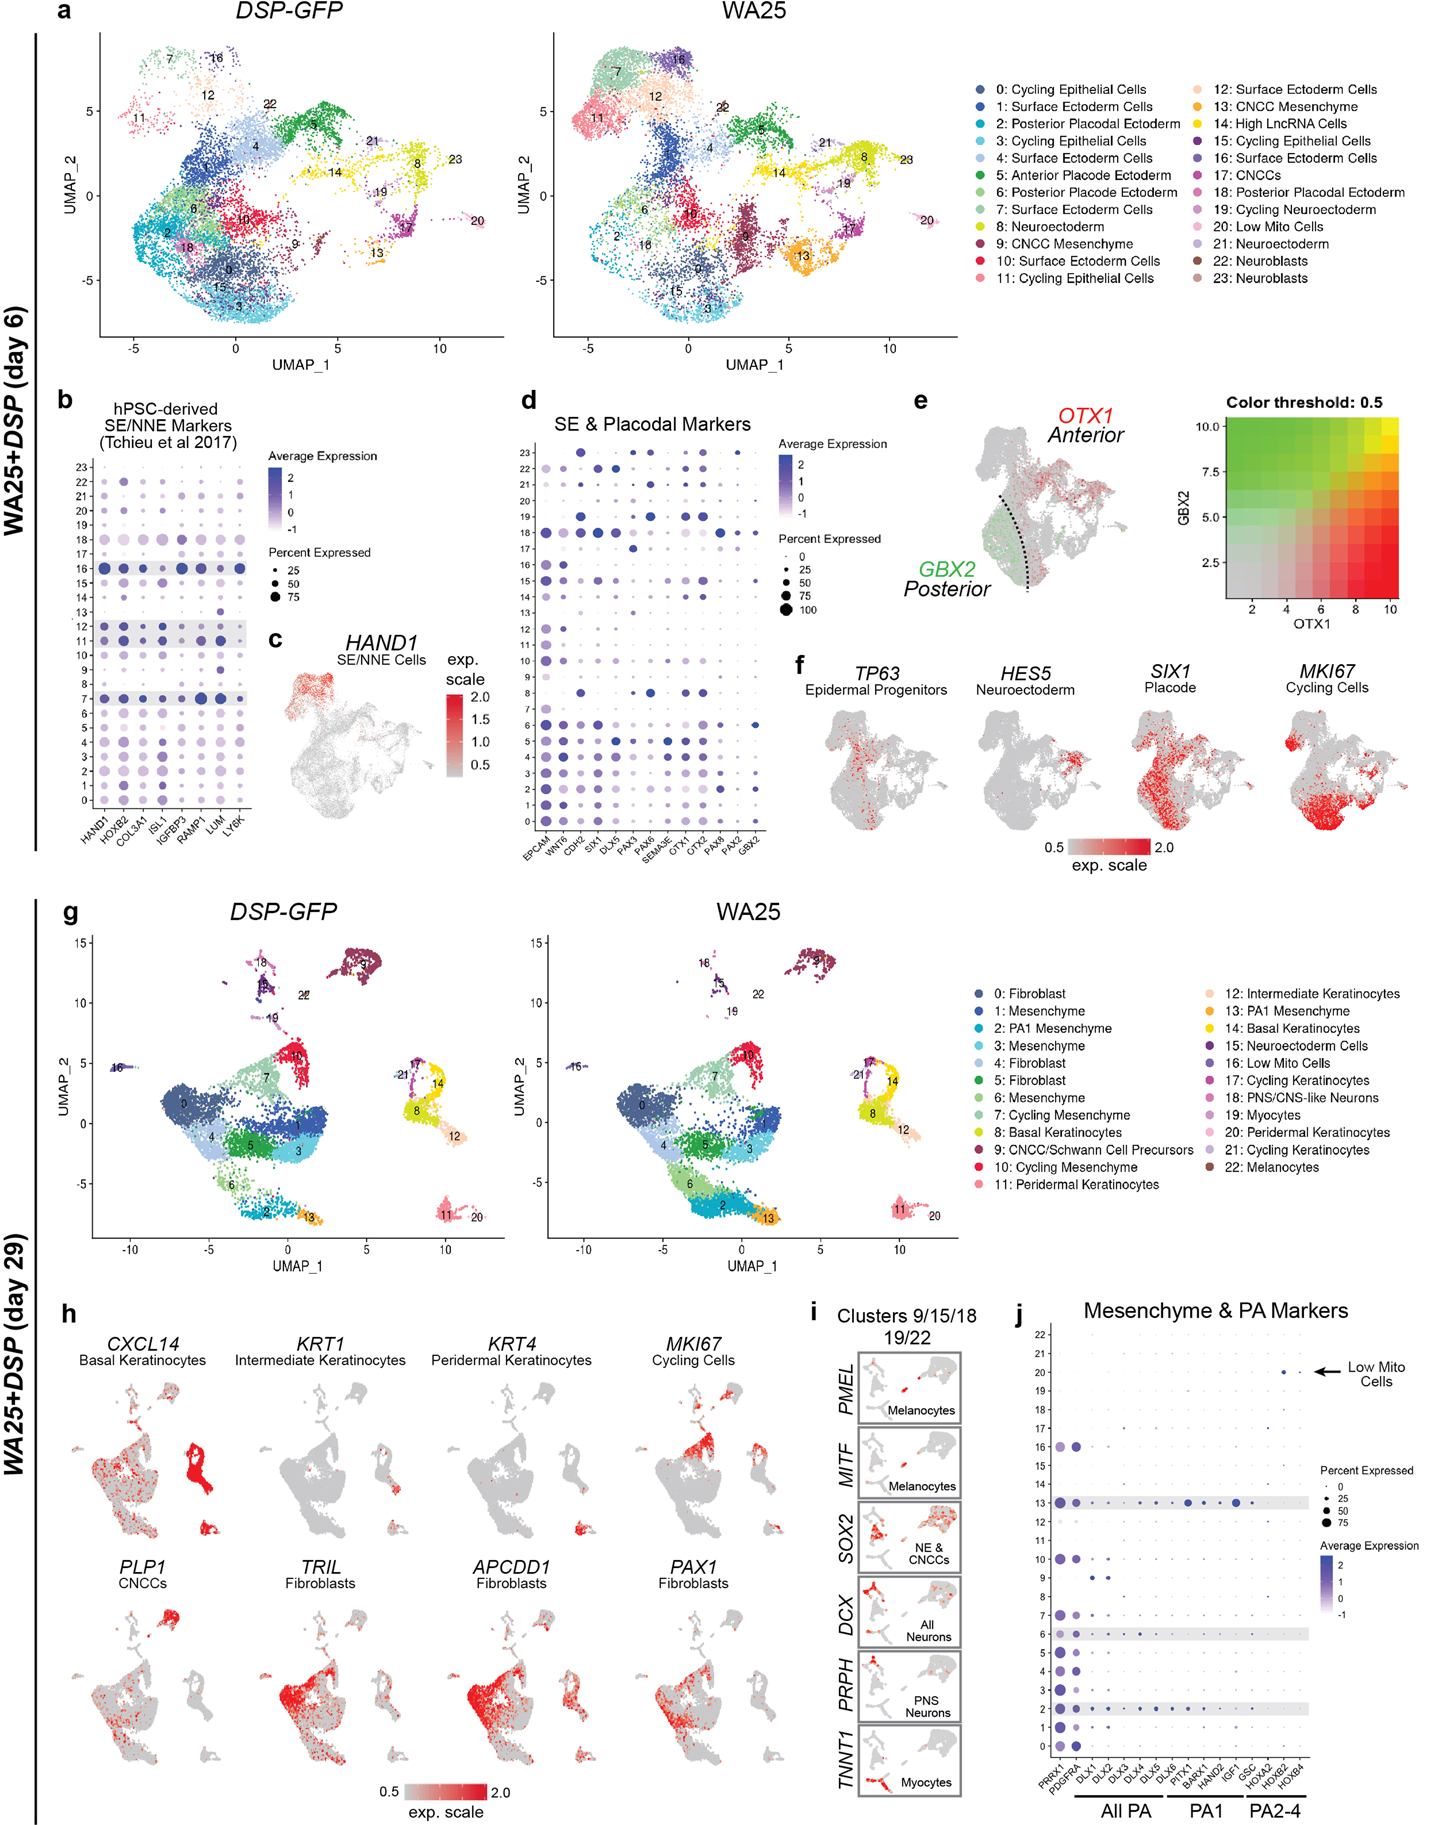
Extended Data Figure 5 |. Single-cell RNA-seq analysis of day-6 and day-29 skin organoids derived from WA25 and DSP-GFP cells.

a, g, Separate uniform manifold approximation projections (UMAP) for WA25 and DSP-GFP cell clusters at day-6 and day-29. The major cell cluster groupings of surface epithelia, epidermis, and mesenchyme are noted. Colours indicate cell state. The presumptive cell identities, based on a priori knowledge of marker genes, are listed. Cell clusters with no discernable identity had either low mitochondrial or high long non-coding RNA gene expression and are labeled “Low Mito Cells” and “High LncRNA”, respectively. n = day-6: 11,785 WA25 cells, 11,544 DSP-GFP cells; day-29: 9,268 WA25 cells, 9,013 DSP-GFP cells. Ten day-6 organoids from one experiment and five day-29 organoids from one experiment were randomly pooled for scRNA-seq analysis (per cell line). b, Dot plot for SE and NNE markers based on RNA-seq data from Tchieu et al. Cell Stem Cell 2017. c, UMAP plot for HAND1, a key marker for NNE cells derived from hPSCs. d, Dot plot for SE and anterior-posterior placodal markers. Gene expression frequency is indicated by spot size and expression level is indicated by colour intensity. e, UMAP overlay plot showing the distribution of OTX1 (Anterior placode/Neuroectoderm marker) and GBX2 (Posterior placode marker). f, UMAP plots for key markers of epidermal progenitors, neuroectoderm, general placode, and cycling cells. h, UMAP plots for specific marker genes that define epidermal, cycling, CNCC, and dermal cell subtypes. i, Magnified view of clusters 9 (CNCC and Schwann Cell Precursors), 15 (Neuroectoderm Cells), 18 (PNS/CNS-like Neurons), 19 (Myoctyes), 22 (Melanocytes). Key marker genes are displayed to label each cell cluster. SOX2 has broad expression across Neuroectoderm and CNCCs. j, Dot plot for general mesenchymal (PRRX1, PDGFRA), PA, PA1, and PA2–4 markers. Gene expression frequency is indicated by spot size and expression level is indicated by colour intensity. Note expression of HOX genes appears limited to a subset of high LncRNA gene expressing cells. Abbr: surface ectoderm (SE); non-neural ectoderm (NNE); cranial neural crest cell (CNCC); pharyngeal arch (PA). Corresponds with data in Fig. 2.
