

Key Points
Question
How is severe traumatic injury associated with individuals’ ability to work and earn income?
Findings
In this population-based cohort study of 5167 adults who had employment and were hospitalized with severe traumatic injury, 79.3% were employed 3 years after injury, compared with 91.7% of matched control participants, with a resultant mean earnings loss of 19.0%. Those in the lowest tercile of preinjury income were 3-fold less likely than those in the highest tercile to be employed 3 years after injury.
Meaning
Substantial loss in employment and earnings persists for at least 3 years after severe traumatic injury among adults who were previously employed.
This matched case-control study of a national Canadian cohort uses tax data to evaluate the association of severe traumatic injury with subsequent employment and earnings in survivors of trauma vs control participants without injuries.
Abstract
Importance
Traumatic injury disproportionately affects adults of working age. The ability to work and earn income is a key patient-centered outcome. The association of severe injury with work and earnings appears to be unknown.
Objective
To evaluate the association of severe traumatic injury with subsequent employment and earnings in long-term survivors.
Design, Setting, and Participants
This is a retrospective, matched, national, population-based cohort study of adults who had employment and were hospitalized with severe traumatic injury in Canada between January 2008 and December 2010. All acute care hospitalizations for severe injury were included if they involved adults aged 30 to 61 years who were hospitalized with severe traumatic injury, working in the 2 years prior to injury, and alive through the third calendar year after their injury. Patients were matched with unexposed control participants based on age, sex, marital status, province of residence, rurality, baseline health characteristics, baseline earnings, self-employment status, union membership, and year of the index event. Data analysis occurred from March 2019 to December 2019.
Main Outcomes and Measures
Changes in employment status and annual earnings, compared with unexposed control participants, were evaluated in the third calendar year after injury. Weighted multivariable probit regression was used to compare proportions of individuals working between those who survived trauma and control participants. The association of injury with mean yearly earnings was quantified using matched difference-in-difference, ordinary least-squares regression.
Results
A total of 5167 adults (25.6% female; mean [SD] age, 47.3 [8.8] years) with severe injuries were matched with control participants who were unexposed (25.6% female; mean [SD] age, 47.3 [8.8] years). Three years after trauma, 79.3% of those who survived trauma were working, compared with 91.7% of control participants, a difference of −12.4 (95% CI, −13.5 to −11.4) percentage points. Three years after injury, patients with injuries experienced a mean loss of $9745 (95% CI, −$10 739 to −$8752) in earnings compared with control participants, representing a 19.0% difference in annual earnings. Those who remained employed 3 years after injury experienced a 10.8% loss of earnings compared with control participants (−$6043 [95% CI, −$7101 to −$4986]). Loss of work was proportionately higher in those with lower preinjury income (lowest tercile, −18.5% [95% CI, −20.8% to −16.2%]; middle tercile, −11.5% [95% CI, −13.2% to −9.9%]; highest tercile, −6.0% (95% CI, −7.8% to −4.3%]).
Conclusions and Relevance
In this study, severe traumatic injury had a significant association with employment and earnings of adults of working age. Those with lower preinjury earnings experienced the greatest relative loss of employment and earnings.
Introduction
Traumatic injury disproportionately affects adults of working age.1 Improvements in trauma care have increased the number of individuals who survive severe injury.2,3 For every death attributable to trauma, approximately 13 people survive.4,5 Given the relative youth of many survivors of trauma, understanding the long-term outcomes of injury is critical. There have been calls for research focusing on issues important to survivors of trauma, particularly the ability to return to work.6,7,8,9
Employment is an important determinant of physical and mental health.10,11,12 Returning to work and earning income following illness or injury are important patient-centered outcomes.10,13,14 The link between socioeconomic status and health has been well established, and lower socioeconomic status is directly linked to adverse outcomes after injury, including anxiety, depression, worse functional outcomes, and long-term mortality.15,16,17 In addition to the influence of loss of earnings on individual survivors, the familial and socioeconomic outcomes of trauma are substantial.18,19
Interventions are needed to maximize trauma patients’ ability to return to work and mitigate income loss. However, such interventions require accurate data characterizing the economic outcome of injury on individuals and identifying those at highest risk for adverse labor market outcomes. Prior work evaluating economic outcomes in traumatic injury have been limited by small sample sizes, inclusion of patients with mild injuries, use of self-reported data, and lack of control participants without injuries.15,16,20,21,22,23,24,25 We conducted a national, population-based study to evaluate the association of severe traumatic injury with employment and earnings, using individual-level tax data to quantify the economic consequences of injury. We hypothesized that 3 years after severe traumatic injury, long-term survivors of working age would experience substantial reductions in the ability to work and earn. We also hypothesized that individuals with the lowest preinjury earnings would be most vulnerable to the economic influence of severe injury.
Methods
Study Design
This retrospective, matched, population-based cohort study evaluated adults who had employment and were hospitalized with severe traumatic injury in Canada between January 2008 and December 2010. This study was approved by the University of Manitoba Health Research Ethics Board. Informed consent was waived by the Research Ethics Board, given the use of administrative health data.
Data Sets and Linkage
Data were derived from the Canadian Hospitalization and Taxation Database (C-HAT), a previously described linkage of population-based Canadian hospital and individual income tax data (eAppendix 1 in the Supplement).26 The C-HAT links data from the Discharge Abstract Database with tax data from the T1 Family File. The Discharge Abstract Database captures all acute care hospitalizations in the country, with the exception of those in the province of Quebec. The T1 Family File contains yearly tax returns for all Canadian individuals. We excluded Canada’s 3 territories, since the C-HAT linkage rates for individuals residing in these regions are significantly lower than in the provinces.26
Study Population
We identified all adults aged 30 to 61 years who were hospitalized from 2008 to 2010 with severe traumatic injury, working in the 2 years before injury, and alive through the third calendar year postinjury. The calendar year of the index event was identified as Y0, the third year postinjury as Y + 3, etc. The lower age cutoff was selected to maximize the probability that individuals had stably entered the job market by having completed postsecondary education and work training. The upper age limit was chosen to avoid having the follow-up period impinge on the typical retirement age of 65 years.
Traumatic injury was identified by hospital International Statistical Classification of Diseases, Tenth Revision, With Canadian Enhancements (ICD-10-CA) diagnosis codes ranging S00 to T79.0 (eTable 1 in the Supplement). Severe injury was defined as an Injury Severity Score (ISS) greater than 15, a commonly used definition.1 The ISS were derived from ICD-10-CA diagnoses recorded in the Discharge Abstract Database using a previously validated crosswalk.27 Because patients with trauma commonly undergo transfer across multiple institutions,28 we combined individual hospital records across transfers into episodes of hospital care; episodes were the unit of measure for index hospitalizations.29
We excluded individuals hospitalized in Y0 with injury from burns, poisonings, drowning, exposure, suffocation, overexertion, hanging, submersion, or unknown mechanisms (eTable 1 in the Supplement), since these patients typically do not use regional trauma system resources and are generally not included in evaluations of trauma outcomes.30 We further excluded individuals admitted with any injury-associated diagnosis in Y − 1 or Y − 2 (a blackout period; eTable 1 in the Supplement), to ensure that we were not including individuals hospitalized for complications of prior injuries so that work and income outcomes were attributable to the index event.
Employment in Y − 1 and Y − 2 was defined as having any earnings in those years. Individuals who could not be identified in tax data in any of Y − 1, Y − 2, or Y + 3 were excluded. We also excluded earners of extreme incomes, defined as being in the top and bottom 0.25% of the earnings distribution of the population aged 28 to 64 years during the years 2006 through 2013. All those excluded at the low end of the distribution had negative total earnings, indicating net losses from self-employment.
Control Participants
Control participants unexposed to injury satisfied the same criteria as the exposed cohort, except they were not hospitalized for traumatic injury in Y0. Because of the very large pool of individuals who were unexposed, control participants were chosen from a 30% random sample of the C-HAT database.
Matching
Individuals who were exposed were matched to candidate individuals who were unexposed using coarsened exact matching, a method of weighted balancing within strata that is superior to traditional matching methods.31 We matched on 11 variables: demographics (age, sex, marital status, province, and urban vs rural residence), baseline health characteristics (nonobstetrical hospitalization in Y − 1 and Y − 2), baseline earnings–associated variables (earnings in Y − 1 and Y − 2, self-employment status, and union membership), and the year of the index event. Marital status, province, urban residence, self-employment, and union membership were evaluated in Y − 1. Marital status was categorized as single vs married or in a common law relationship. Union membership was indicated by payment of union dues in tax data. We used normalized differences to indicate parameter balance between matched individuals.
Confounders
In addition to the matching variables, we assessed factors that might modify or confound associations between injury and labor market outcomes (eAppendix 2 in the Supplement): injury characteristics (ISS and presence of severe head injury) and index hospitalization characteristics (admission to a special care unit [intensive care units and intermediate care or stepdown units32], use of invasive mechanical ventilation, and hospital length of stay). Severe head injury was defined as an Abbreviated Injury Scale score of 3 or more in the head region, as derived from the ICD-10-CA to ISS crosswalk.
Outcomes
Our co–primary outcomes were (1) working in the third calendar year after injury, as indicated by nonzero Y + 3 earnings and (2) the change in total annual earnings attributable to the traumatic injury from Y − 1 to Y + 3. Total earnings were calculated as the pretax sum of all wages, salaries, net self-employment income, other employment earnings, and Indian exempt employment income, indexed to 2012 dollars using the Canadian consumer price index. Two secondary outcomes were the changes in total annual earnings attributable to injury from Y − 1 to Y + 1 and from Y − 1 to Y + 2. Canadian dollar values were converted to US dollar values using the mean annual exchange rate in 2012. In 2012, the Canadian dollar and United States dollar were equivalent ($1 Canadian was US $0.99958).33
Analytic Approach
To compare proportions of individuals working at Y + 3 between cases and controls, we used weighted multivariable probit regression on the matched cohorts. We quantified the association of injury with mean yearly earnings using matched difference-in-difference, ordinary least-squares regression; this compares the pre-event–to-postevent change in earnings of individuals with severe injury to the change in earnings of matched control participants who did not experience severe injury.
We performed 3 a priori secondary analyses. First, we performed analyses restricted to individuals working in Y + 3 (as indicated by nonzero earnings in Y + 3). Second, to reduce the contribution of individuals taking an early retirement following their index event, we performed an analysis restricted to individuals 53 years and younger in Y0. Finally, we performed a subset analysis on individuals with severe traumatic head injury (Abbreviated Injury Scale score, ≥3).
For the coprimary outcomes, we performed 9 predefined heterogeneity analyses, assessing factors that might modify the association between outcomes and severe traumatic injury. Here we performed covariate reweighting to ensure that strata based on heterogeneity variables were similar in the other covariates (eAppendix 2 in the Supplement). The preinjury factors evaluated were age, sex, income tercile in Y − 1, marital status, and self-employment status. The postinjury factors evaluated were admission to a special care unit, mechanical ventilation, index hospital length of stay tercile, and presence of severe traumatic head injury. Because of a concern that overall severity of injury (as measured by ISS) might confound the associations between income and severe head injury, we performed an additional heterogeneity analysis stratified on the absence or presence of severe head injury, matching on ISS ranges (scores of 15-24 vs 25-75).
Analyses were performed from March 2019 to December 2019 with Stata 14 (StataCorp). All P values less than .05 were considered statistically significant.
Results
We identified 5341 patients hospitalized with severe traumatic injuries from 2008 through 2010 who were employed in the 2 years prior to injury and alive 3 full calendar years after this index injury. Among 7 070 667 potential control participants, we matched 5167 of 5341 cases (96.7%; 25.6% female; mean [SD] age, 47.3 [8.8] years) to 1 241 819 control participants (25.6% female; mean [SD] age, 47.3 [8.8] years; Table 1; eTable 2 in the Supplement). Of patients with severe injury, 1969 also sustained severe head injury, 1918 (97.4%) of whom were successfully matched to 592 738 control participants (eTable 3 in the Supplement).
Table 1. Baseline Characteristics for Final Matched, Weighted Trauma and Control Cohortsa.
| Variable | All severe traumatic injury, weighted % | Severe traumatic injury with severe head injury, weighted % | ||||
|---|---|---|---|---|---|---|
| Cases | Matched controls | ND | Cases | Matched controls | ND | |
| No. | 5167 | 1 241 819 | NA | 1918 | 592 738 | NA |
| Age, mean (SD), y | 47.3 (8.8) | 47.3 (8.8) | 0.002 | 47.5 (9.0) | 47.5 (8.9) | 0.001 |
| Female | 25.6 | 25.6 | 0.000 | 26.7 | 26.7 | 0.000 |
| Province or region | ||||||
| Newfoundland | 1.6 | 1.6 | 0.000 | 1.9 | 1.9 | 0.000 |
| Prince Edward Island | 0.4 | 0.4 | 0.000 | 0.3 | 0.3 | 0.000 |
| Nova Scotia | 3.4 | 3.4 | 0.000 | 2.9 | 2.9 | 0.000 |
| New Brunswick | 3.7 | 3.7 | 0.000 | 3.3 | 3.3 | 0.000 |
| Ontario | 39.8 | 39.8 | 0.000 | 43.7 | 43.7 | 0.000 |
| Manitoba | 5.2 | 5.2 | 0.000 | 4.3 | 4.3 | 0.000 |
| Saskatchewan | 4.8 | 4.8 | 0.000 | 5.3 | 5.3 | 0.000 |
| Alberta | 20.0 | 20.0 | 0.000 | 18.0 | 18.0 | 0.000 |
| British Columbia | 21.0 | 21.0 | 0.000 | 20.4 | 20.4 | 0.000 |
| Urban residencyb | 81.6 | 81.6 | 0.000 | 83.4 | 83.4 | 0.000 |
| Married/common lawb | 71.7 | 71.7 | 0.000 | 69.1 | 69.1 | 0.000 |
| Children <18 y at homeb | 37.1 | 39.1 | −0.040 | 35.5 | 37.3 | −0.039 |
| Union memberb | 30.1 | 30.1 | 0.000 | 27.8 | 27.8 | 0.000 |
| Self-employedb | 16.6 | 16.6 | 0.000 | 15.4 | 15.4 | 0.000 |
| Earnings, mean (SD), $ | ||||||
| Y − 1 | 52 854 (43 395) | 53 011 (43 955) | −0.004 | 49 578 (41 584) | 49 775 (42 172) | 0.005 |
| Y − 2 | 52 950 (42 717) | 53 179 (43 771) | −0.005 | 49 712 (40 997) | 50 069 (42 162) | 0.009 |
| Hospitalized Y − 1 or Y − 2 | 5.3 | 5.3 | 0.000 | 5.9 | 5.9 | 0.000 |
| ISS >25 | 29.9 | NA | NA | 47.2 | NA | NA |
| Severe head injury | 37.1 | NA | NA | 100.0 | NA | NA |
| Hospital length of stay, median, days (IQR) | 7 (3 − 15) | NA | NA | 7 (3 − 19) | NA | NA |
| Admitted to special care unitc | 32.6 | NA | NA | 42.0 | NA | NA |
| Received invasive mechanical ventilation | 18.1 | NA | NA | 27.8 | NA | NA |
| Treated at trauma center | 67.5 | NA | NA | 77.7 | NA | NA |
Abbreviations: IQR, interquartile range; ISS, Injury Severity Scale; NA, not applicable; ND, normalized difference; Y − 1, calendar year prior to calendar year of index event; Y − 2, calendar year 2 years prior to calendar year of index event.
Earnings are reported in 2012 US dollars.
Urban residence, marital/common law status, presence of children, union membership, and self-employment status are based on data from Y − 1.
Includes intensive care units and intermediate or stepdown units.
Employment Outcomes After Severe Traumatic Injury
Three years after trauma, 79.3% of individuals with severe injuries (by weighted percentage) were working, compared with 91.7% of control participants (by weighted percentage), for a difference of −12.4 (95% CI, −13.5 to −11.4) weighted percentage points (Figure and Table 2; eTable 4 and eTable 5 in the Supplement). Findings were similar in analyses restricted to individuals who were 53 years and younger in Y0 (Table 2). In the subset with severe head injury, the difference in employment rates in Y + 3 between affected individuals and control participants was −18.1 (95% CI, −20.1 to −16.2) percentage points (Figure and Table 2; eTable 4 and eTable 5 in the Supplement).
Figure. Employment and Earnings, Weighted Injury and Control Cohorts.
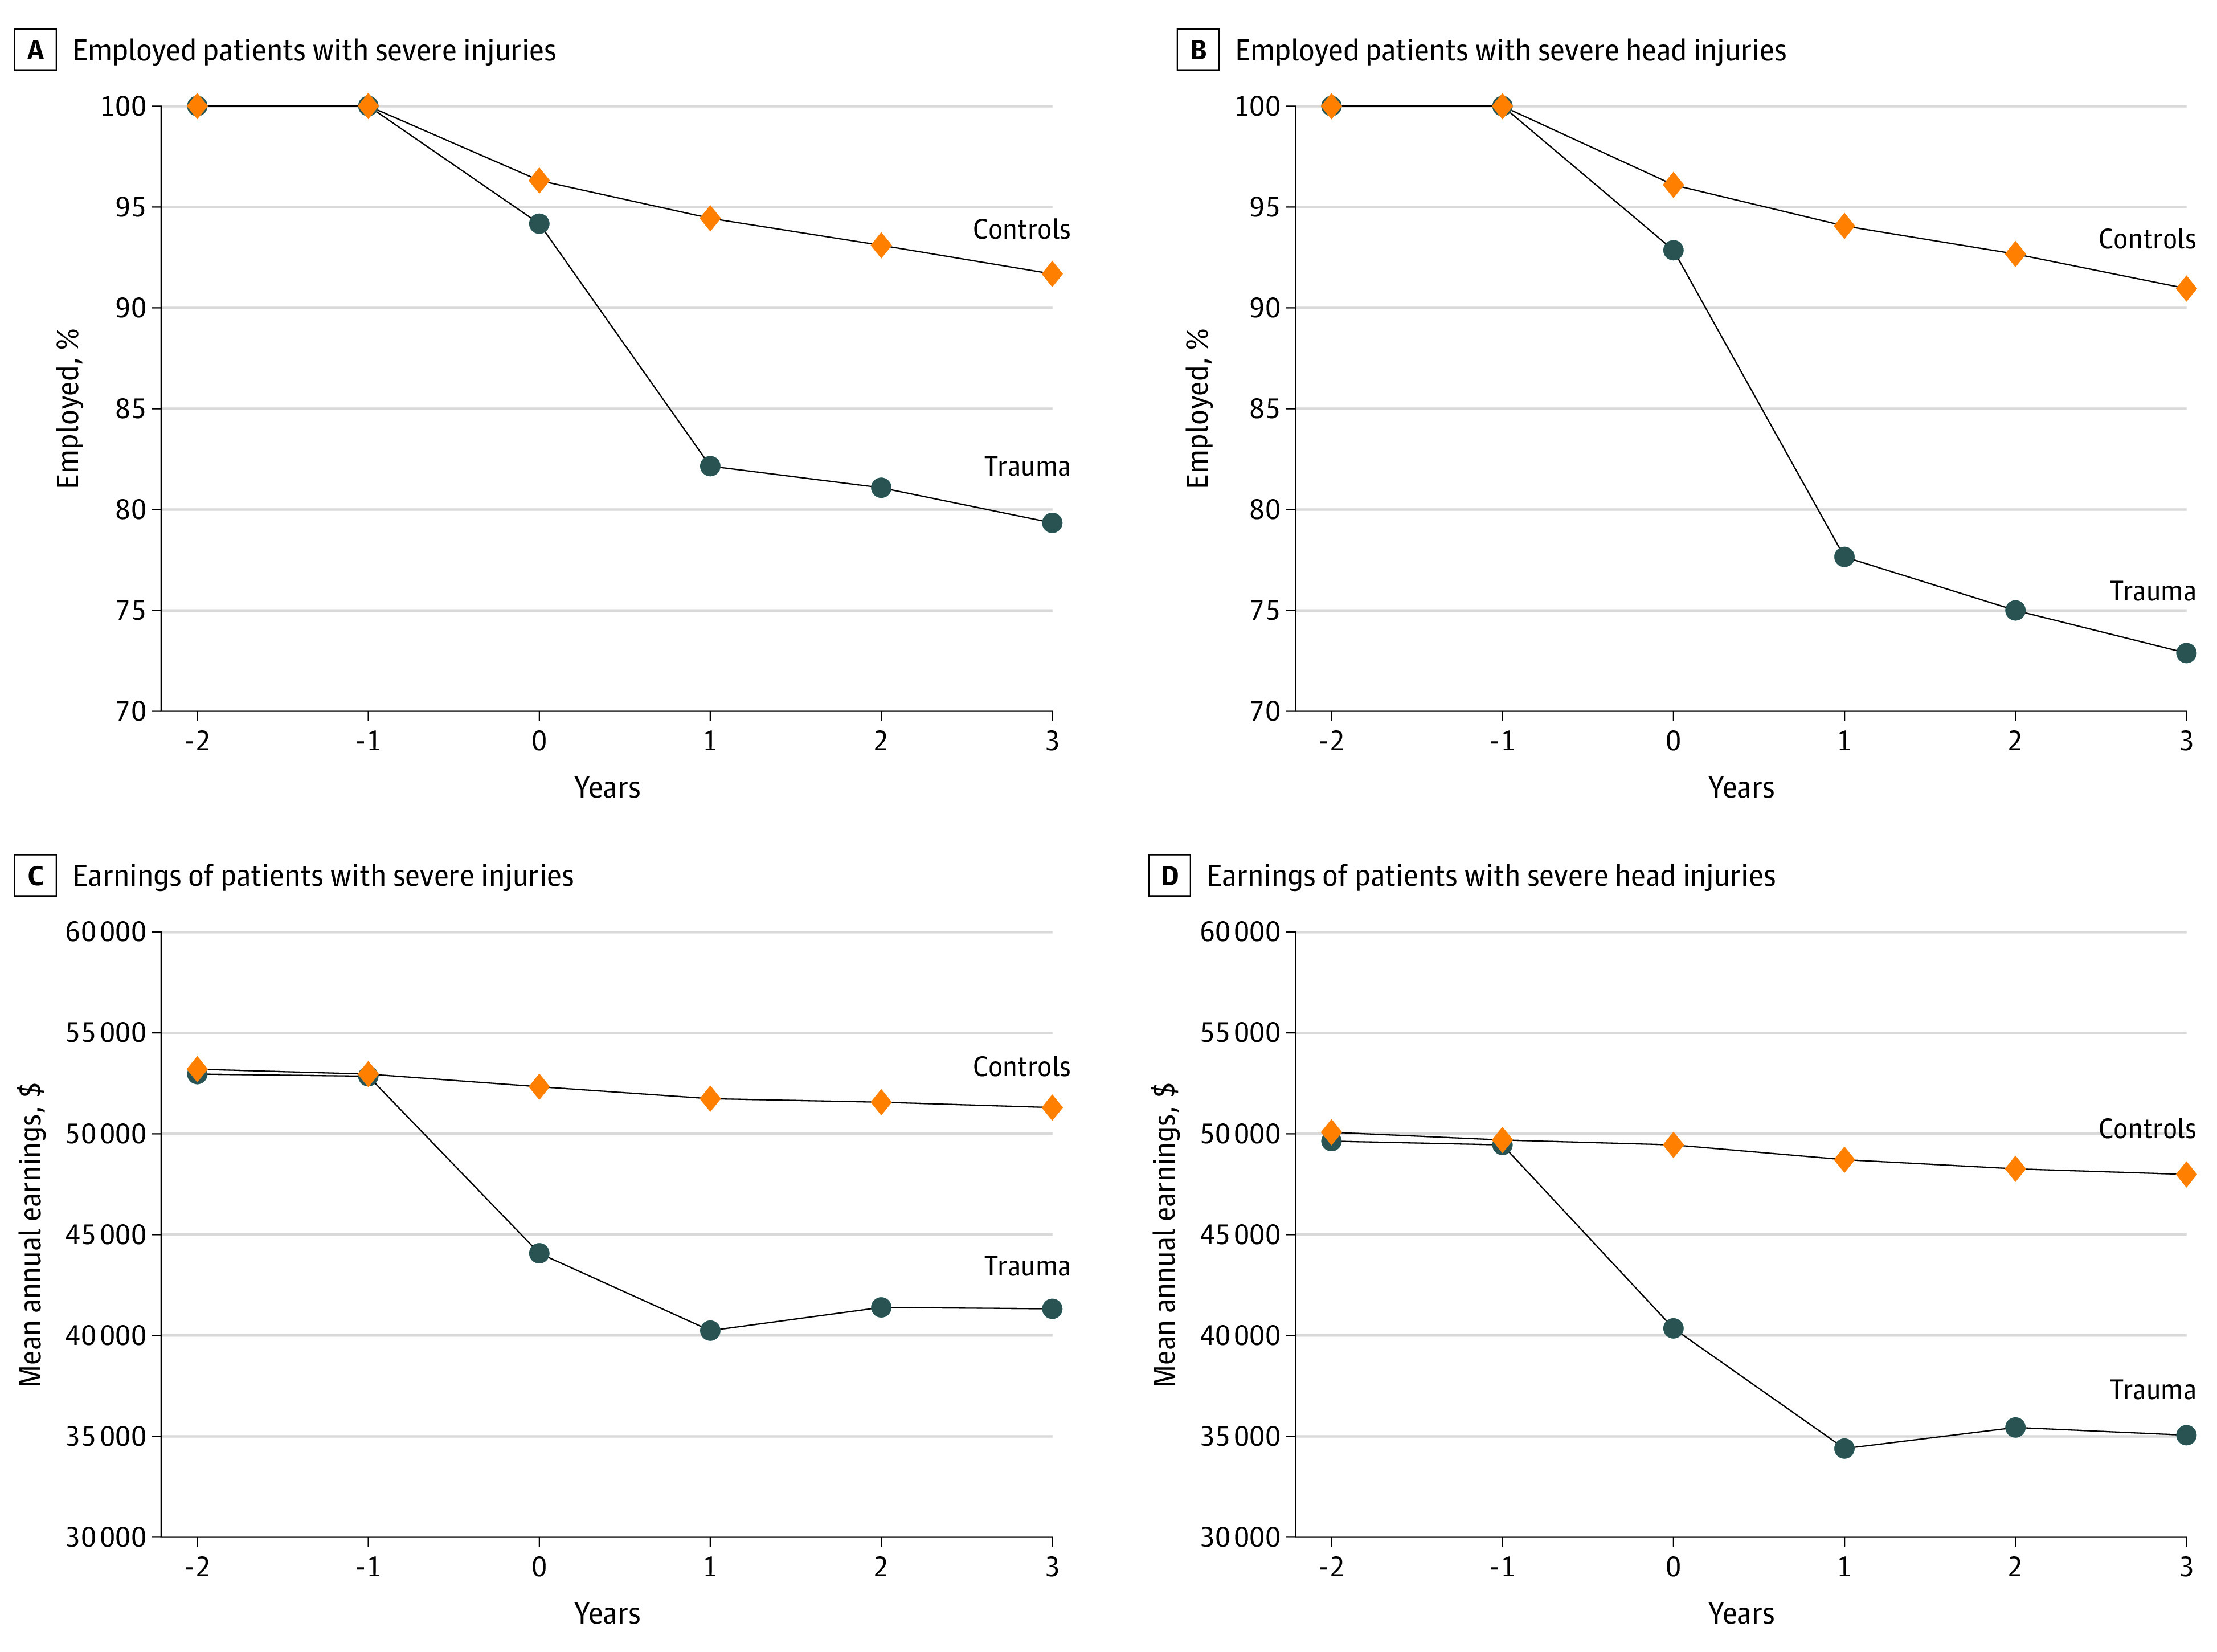
Years are relative to the calendar year of index event. Earnings are reported in 2012 US dollars.
Table 2. Attributable Association of Severe Traumatic Injury With Employment and Earning, 3 Years After Injury (Y + 3) vs the Year Prior to Injury (Y − 1).
| Variable | Difference-in-difference, model-derived outcome attributable to injury, mean (95% CI)a,b | |
|---|---|---|
| Employment, percentage points | Annual earnings, $c | |
| All severe traumatic injury | −12.4 (−13.5 to −11.4) | −9745 (−10 739 to −8752) |
| Working in Y + 3 | NA | −6043 (−7101 to −4986) |
| Age < 53 y in index y | −12.7 (−13.9 to −11.4) | −10 147 (−11 287 to −9008) |
| Severe traumatic injury with severe head injury | −18.1 (−20.1 to −16.2) | −12 804 (−14 426 to −11 182) |
| Working in Y + 3 | NA | −7848 (−9680 to −6017) |
| Age < 53y in index y | −17.9 (−20.1 to −15.7) | −13 746 (−15 667 to −11 825) |
Abbreviation: NA, not applicable.
Difference between patients with injuries and control participants in pre-injury–to-postinjury change, derived from weighted multivariable modeling.
All P values are <.001.
Earnings are reported in 2012 US dollars.
Change in Earnings After Severe Traumatic Injury
Earnings in Y + 3 were significantly lower for survivors of trauma than for the matched cohort. Those with injury experienced a mean decline in earnings between Y − 1 and Y + 3 of $9745 (95% CI, −$10 739 to −$8752) greater than that of control participants (Figure and Table 2; eTable 5 in the Supplement), representing a 19.0% difference in Y + 3 earnings (eTable 5 in the Supplement). When the cohort was limited to those individuals who were working at Y + 3, loss of earnings was still substantial when comparing individuals with injuries and control participants (−$6043 [95% CI, −$7101 to −$4986], a 10.8% difference). Significant differences in earnings persisted when the cohort was limited to individuals 53 years and younger in Y0 (−$10 147 [95% CI, −$11 287 to −$9008]).
Compared with control participants, loss of work and earnings at Y + 3 was even greater among individuals who also sustained a severe traumatic head injury. The mean loss of earnings in patients with severe head injury was $12 804 (95% CI, −$14 426 to $−11 182) greater than that of control participants, representing a 26.6% difference in Y + 3 earnings. Differences between individuals with injuries and control participants were well established by Y + 1, remaining stable or slightly narrowing over the 3 years postinjury (Figure; eTable 5 in the Supplement).
Association Between Patient and Injury Characteristics and Employment Outcomes and Earnings
There was significant heterogeneity in the association between severe traumatic injury and labor market outcomes in Y + 3 (Table 3; eTable 6 in the Supplement). Sex, marital status, and self-employment status were not important effect modifiers. Notably, low preinjury income was associated with a significantly lower probability of being employed in Y + 3 (mean difference-in-difference change in percentage employed: low income tertile, −18.5% [95% CI, −20.8% to −16.2%]; middle income tertile, −11.5% [95% CI, −13.2% to −9.9%]; high income tertile, −6.0% [95% CI, −7.8% to −4.3%]; P = .001). Increased probability of unemployment and lower earnings in Y + 3 were also associated with admission to an intensive or special care unit (mean difference-in-difference change in percentage employed: with intensive or special care unit, −22.1% [95% CI, −24.4% to −19.8%] vs none, −7.8% [95% CI, −9.1% to −6.6%]; P < .001; mean difference-in-difference of change in earnings: with intensive or special care unit, −$17 264 [95% CI, −$19 274 to −$15 255] vs none, −$7235 [95% CI, −$8345 to −$6126]; P < .001), mechanical ventilation (mean difference-in-difference change in percentage employed: yes, −26.8% [95% CI, −30.1% to −23.5%] vs no, −9.0% [95% CI, −10.2% to −7.8%]; P < .001; mean difference-in-difference of change in earnings: yes, −$22 472 [95% CI, −$25 486 to −$19 457] vs no, −$7235 [95% CI, −$8345 to −$6126]; P < .001), longer index hospital length of stay (mean difference-in-difference change in percentage employed: low tercile, −5.6% [95% CI, −7.3% to −3.8%]; middle tercile, −8.9% [95% CI, −10.9% to −6.9%]; high tercile, −23.6% [95% CI, −26.1% to −21.2%]; P < .001; mean difference-in-difference of change in earnings: low tercile, −$3613 [95% CI, −$5300 to −$1927]; middle tercile, −$7495 [95% CI, −$9287 to −$5703]; high tercile, −$19 016 [95% CI, −$21 235 to −$16 797]; P < .001), and presence of a severe head injury (mean difference-in-difference change in percentage employed: yes, −17.9% [95% CI, −19.9% to −15.8%] vs no, −9.3% [95% CI, −10.7% to −7.9%]; P < .001; mean difference-in-difference of change in earnings: yes, −$13 916 [95% CI, −$15 883 to −$11 950] vs no, −$7552 [95% CI, −$8815 to −$6289]; P < .001). For example, among patients who required mechanical ventilation following injury, the mean fall in earnings from Y − 1 to Y + 3 was $22 472 (95% CI, −$25 486 to −$19 457) greater than in matched control participants.
Table 3. Attributable Association of Severe Traumatic Injury With Change in Employment and Earning, 3 Years After Injury (Y + 3) vs the Year Prior to Injury (Y − 1), by Heterogeneity Analyses.
| Variable | Difference-in-difference, model-derived outcome attributable to injurya | |||
|---|---|---|---|---|
| Employment, mean % (95% CI) | P value | Earnings, mean (95% CI), $b | P value | |
| Age range, y | ||||
| 30-45 | −12.7 (−14.4 to −11.0) | <.001 | −11 157 (−12 788 to −9527) | .18 |
| 46-53 | −13.6 (−15.6 to −11.6) | −9570 (−11 334 to −7805) | ||
| 54-61 | −11.8 (−14.1 to −9.5) | −8749 (−10 694 to −6804) | ||
| Sex | ||||
| Male | −12.7 (−14.0 to −11.4) | .64 | −9449 (−10 588 to −8311) | .63 |
| Female | −12.8 (−15.2 to −10.4) | −10 088 (−12 719 to −7456) | ||
| Y − 1 earnings, tercile | ||||
| Low | −18.5 (−20.8 to −16.2) | .001 | −6543 (−7579 to −5507) | .003 |
| Middle | −11.5 (−13.2 to −9.9) | −9879 (−11 358 to −8401) | ||
| High | −6.0 (−7.8 to −4.3) | −14 629 (−17 995 to −11 263) | ||
| Marital statusc | ||||
| Single | −13.7 (−15.9 to −11.5) | .41 | −11 282 (−13 450 to −9114) | .53 |
| Married or common law relationship | −12.3 (−13.6 to −10.9) | −9520 (−10 691 to −8349) | ||
| Self-employedc | ||||
| No | −13.0 (−14.3 to −11.7) | .74 | −9959 (−11 075 to −8844) | .79 |
| Yes | −10.0 (−12.9 to −7.1) | −8956 (−12 489 to −5424) | ||
| Index hospital length of stay, tercile | ||||
| Low | −5.6 (−7.3 to −3.8) | <.001 | −3613 (−5300 to −1927) | <.001 |
| Intermediate | −8.9 (−10.9 to −6.9) | −7495 (−9287 to −5703) | ||
| High | −23.6 (−26.1 to −21.2) | −19 016 (−21 235 to −16 797) | ||
| Intensive or special care unit | ||||
| No | −7.8 (−9.1 to −6.6) | <.001 | −5896 (−7117 to 4676) | <.001 |
| Yes | −22.1 (−24.4 to −19.8) | −17 264 (−19 274 to −15 255) | ||
| Mechanical ventilation | ||||
| No | −9.0 (−10.2 to −7.8) | <.001 | −7235 (−8345 to −6126) | <.001 |
| Yes | −26.8 (−30.1 to −23.5) | −22 472 (−25 486 to −19 457) | ||
| Severe head injury | ||||
| No | −9.3 (−10.7 to −7.9) | <.001 | −7552 (−8815 to −6289) | <.001 |
| Yes | −17.9 (−19.9 to −15.8) | −13 916 (−15 883 to −11 950) | ||
Difference between individuals with injuries and control participants in pre-injury–to-postinjury change, derived from weighted multivariable modeling.
Earnings are reported in 2012 US dollars.
Marital or common law status and self-employment status based on status in Y − 1.
The subset of trauma patients with severe injuries who also experienced severe head injury had systematically higher mean (SD) ISS than did those without severe head injury (24.3 [9.4] vs 20.8 [7.6]; P < .001). Our main heterogeneity analysis (Table 3; eTable 7 in the Supplement) did not adjust for this difference. To account for this systematic difference in injury severity, we further matched patients on ISS (Table 4), after which trauma with severe head injury continued to be associated with significantly greater negative outcomes on work and earnings compared with trauma without severe head injury (mean difference-in-difference change in percentage employed: with severe head injury, −16.5 [95% CI, −18.7 to −14.4] percentage points; P < .001; vs without severe head injury, −10.3 [95% CI, −11.9 to −8.7] percentage points; mean difference-in-difference of change in earnings: with severe head injury, −$12 415 [95% CI, −$14 394 to −$10 436] vs without severe head injury, −$8301 [95% CI, −$9666 to −$6937]; P < .001). However, the differences between patients with and without severe head injury were attenuated by matching for ISS; the difference in proportion of individuals working dropped from 8.6 percentage points before ISS matching to 6.2 percentage points afterward, and differences in annual earnings dropped from $6364 before ISS matching to $4114 afterward.
Table 4. Additional Heterogeneity Analysis of Association of Severe Traumatic Injury With Change in Employment and Earnings 3 Years After Injury vs the Year Prior to Injury, by Severe Head Injury Status, Additionally Matched on Categorized Injury Severity Score Categoriesa.
| Severe head injury | Difference-in-difference, model-derived outcome attributable to injuryb | |
|---|---|---|
| Employment, percentage points, mean (95% CI) | Annual earnings, mean (95%CI), $c | |
| No | −10.3 (−11.9 to −8.7) | −8301 (−9666 to −6937) |
| Yes | −16.5 (−18.7 to −14.4)d | −12 415 (−14 394 to −10 436)d |
Injury Severity Score categories: 15 to 24 vs 25 to 75.
Difference between injured and controls in pre-injury–to-postinjury change, derived from weighted multivariable modeling.
Earnings are reported in 2012 US dollars.
P < .001 for difference by severe head injury status.
Discussion
In this national study, we found that 3 years after severe trauma, 21% of individuals of working age were not employed, compared with 8% of control participants without injuries. There was a mean 19% loss of earnings among patients with injuries compared with control participants without injuries. Patients with multiple trauma including severe head injury had even more significant economic losses: at 3 years, 27% were not employed (compared with only 9% of control participants) and affected individuals lost a mean of more than a quarter of their earnings.
The outcome of severe injury was heterogeneous across the affected population. Individuals with lower preinjury income were more vulnerable to adverse economic outcomes. Compared with the highest tercile, those in the lowest tercile of preinjury income were more than 3-fold less likely to be employed 3 years later and experienced earnings loss (preemployment income minus lost earnings) that would place their earnings below Canada’s poverty line.34 This association between low preinjury income and postinjury economic outcomes is likely multifactorial. We hypothesize that individuals with low incomes are more likely to have employment that requires physical labor; postinjury physical disability would preclude returning to this type of work. Indeed, prior work demonstrates that individuals who perform manual labor are overrepresented among those who do not return to work after injury.16 In addition, post–acute care support (physical therapy, occupational therapy, assistive devices, etc) is key to recovery postinjury but costly and incompletely covered by public funding. This is particularly true in jurisdictions without universal health insurance, such as the US, where access to health insurance has been directly linked to access to post–acute care facilities and home care services.35 As a result of these and other factors, it is likely that many individuals with low preinjury income and severe injury become trapped in a cycle in which they are both unable to return to work because of disability and unable to afford the rehabilitation services that might facilitate their recovery. In populations without universal health insurance, these losses would be compounded by other financial toxicities, such as those associated with primary hospitalization charges.36
Trauma is a worldwide concern and, despite improvements in trauma care, continues to be a leading cause of disability for adults of working age.37 To our knowledge, ours is the first study to use tax data to evaluate the association of severe traumatic injury with labor market outcomes. We were not only able to evaluate patients’ ability to return to work but also quantify the economic outcome of injury, including among those who did return to work. This second analysis is critical, as a return to work on modified duties or in a different position may result in significant income loss and economic hardship, an outcome not captured if a return to work is as assessed solely as a dichotomous outcome. Most prior studies have been single-center studies, had self-reported outcomes, and/or included patients with both minor and major injuries.20,21,22,23,24,25,38,39 A recent population-based study16 from Australia focused on individuals sustaining severe trauma who were either working or studying at the time of injury. At 24 months, based on self-report, 60% had returned to work or study. As in the present study, lower socioeconomic status was associated with a lower probability of returning to work or study. The same authors40 evaluated return to work in a population-based cohort 4 years after injury. Among individuals who were employed preinjury, 20% never returned to work, with another 13% attempting but failing to return to work. As in our data, head injury was associated with a lower rate of return to work. In the US, a multicenter study41 of outcomes following injury demonstrated that, at 1 year, 40% of survivors of trauma were unable to return to work. The similarities between our findings and the Australian and US data speak to the generalizability of our conclusions.
Our study has notable strengths. Because it used population-based data and included the approximate one-third of patients with trauma who are not treated in designated trauma centers,28 our findings are broadly generalizable, at least within Canada. The matched, difference-in-difference methodology reduces bias, allowing us to better quantify the economic burden attributable to the injury event.42
Limitations
Our study also has limitations. First, eligible patients residing in Quebec and the 3 Canadian territories were excluded. Although these regions represent approximately 23% of the Canadian population, we are not aware of any programs which would substantially affect individuals’ ability to work following trauma in these regions. Second, because of limitations in the sample size and availability of clinical data, we were unable to stratify the cohort to further evaluate how several injury-associated factors lead to heterogeneity in our outcomes of interest. For example, it is likely that factors such as musculoskeletal injury and low Glasgow Coma Scale scores on admission are associated with heterogeneity in subsequent economic outcomes. Finally, our study focused on employment and earnings; individuals may have additional sources of income that we did not capture, including spousal earnings, investment income, and insurance payments. However, individual earnings represent a mean of 84% of total income for individuals in the age groups we studied.43
Conclusions
Loss of employment and earnings are important consequences of acute health shocks, affecting individuals and their families, as well as society. For individuals and families, an inability to work and low income have been linked to poor overall health and higher mortality. For society, health-associated earning losses both reduce governmental tax receipts and increase payouts in the form of disability and other forms of insurance. This study provides actionable estimates of the attributable outcome of severe injury on employment and earnings among survivors. Our finding that individuals who are economically vulnerable at the time of injury are the most likely to experience loss of employment and earnings following their injury is particularly relevant to planning interventions. Our data speak to the importance of making rehabilitation care and return-to-work initiatives accessible to individuals with injuries, particularly those with low income. Given the economic association of injury with these individuals of working age and society, it is plausible that such programs would be cost-effective.
eAppendix 1. Methods: Datasets and Linkage.
eTable 1. ICD-10-CA inclusion/exclusion criteria for exposed and unexposed control cohorts.
eAppendix 2. Methods: Analysis.
eTable 2. Baseline characteristics for the severe traumatic injury and controls cohorts.
eTable 3. Baseline characteristics for the severe traumatic injury with severe head injury and control cohorts.
eTable 4. Labor market outcomes, weighted, by year and cohort.
eTable 5. Impact of severe traumatic injury on employment and earning, by post-event year
eTable 6. Absolute and relative magnitudes of earnings changes in the third year after severe traumatic injury, by earnings tercile in the year prior to injury.
eTable 7. Percentage of original health shock cohorts lost in reweighting for heterogeneity analysis
eReferences. Supplemental References.
References
- 1.Committee on Trauma of the American College of Surgeons National Trauma Data Bank 2016 annual report. Published 2016. Accessed September 22, 2020. https://www.facs.org/~/media/files/quality%20programs/trauma/ntdb/ntdb%20annual%20report%202016.ashx
- 2.Dutton RP, Stansbury LG, Leone S, Kramer E, Hess JR, Scalea TM. Trauma mortality in mature trauma systems: are we doing better? an analysis of trauma mortality patterns, 1997-2008. J Trauma. 2010;69(3):620-626. doi: 10.1097/TA.0b013e3181bbfe2a [DOI] [PubMed] [Google Scholar]
- 3.Ma J, Ward EM, Siegel RL, Jemal A. Temporal trends in mortality in the United States, 1969-2013. JAMA. 2015;314(16):1731-1739. doi: 10.1001/jama.2015.12319 [DOI] [PubMed] [Google Scholar]
- 4.Centers for Disease Control and Prevention Web-based Injury Statistics Query and Reporting System (WISQARS): fatal injury data. Published 2017. Accessed September 22, 2020. https://www.cdc.gov/injury/wisqars/index.html
- 5.Centers for Disease Control and Prevention Web-based Injury Statistics Query and Reporting System (WISQARS): nonfatal injury data. Published 2017. Accessed September 22, 2020. https://www.cdc.gov/injury/wisqars/index.html
- 6.Nathens AB. Life after discharge following major injury: expanding our notion of quality in trauma care. Ann Surg. 2016;263(4):633-635. doi: 10.1097/SLA.0000000000001643 [DOI] [PubMed] [Google Scholar]
- 7.Mann NC, Mullins RJ. Research recommendations and proposed action items to facilitate trauma system implementation and evaluation. J Trauma. 1999;47(3)(suppl):S75-S78. doi: 10.1097/00005373-199909001-00016 [DOI] [PubMed] [Google Scholar]
- 8.Ardolino A, Sleat G, Willett K. Outcome measurements in major trauma—results of a consensus meeting. Injury. 2012;43(10):1662-1666. doi: 10.1016/j.injury.2012.05.008 [DOI] [PubMed] [Google Scholar]
- 9.National Academies of Sciences, Engineering, and Medicine A national trauma care system: integrating military and civilian trauma systems to achieve zero preventable deaths after injury. Published 2016. Accessed September 22, 2020. https://www.nap.edu/catalog/23511/a-national-trauma-care-system-integrating-military-and-civilian-trauma [PubMed]
- 10.Waddell G, Buron AK. Is Work Good for Your Health and Well-being? TSO; 2006. [Google Scholar]
- 11.Rueda S, Chambers L, Wilson M, et al. Association of returning to work with better health in working-aged adults: a systematic review. Am J Public Health. 2012;102(3):541-556. doi: 10.2105/AJPH.2011.300401 [DOI] [PMC free article] [PubMed] [Google Scholar]
- 12.Roelfs DJ, Shor E, Davidson KW, Schwartz JE. Losing life and livelihood: a systematic review and meta-analysis of unemployment and all-cause mortality. Soc Sci Med. 2011;72(6):840-854. doi: 10.1016/j.socscimed.2011.01.005 [DOI] [PMC free article] [PubMed] [Google Scholar]
- 13.Health Quality Ontario Quality matters: realizing excellent care of all. Published 2015. Accessed September 22, 2020. http://www.hqontario.ca/portals/0/Documents/pr/realizing-excellent-care-for-all-en.pdf
- 14.Patient-Centered Research Outcomes Institute Research we support. Published September 10, 2014. Accessed December 9, 2018. https://www.pcori.org/research-results/about-our-research/research-we-support
- 15.Gabbe BJ, Simpson PM, Cameron PA, et al. Long-term health status and trajectories of seriously injured patients: a population-based longitudinal study. PLoS Med. 2017;14(7):e1002322. doi: 10.1371/journal.pmed.1002322 [DOI] [PMC free article] [PubMed] [Google Scholar]
- 16.Gabbe BJ, Simpson PM, Harrison JE, et al. Return to work and functional outcomes after major trauma: who recovers, when, and how well? Ann Surg. 2016;263(4):623-632. doi: 10.1097/SLA.0000000000001564 [DOI] [PubMed] [Google Scholar]
- 17.Krause JS, Carter RE. Risk of mortality after spinal cord injury: relationship with social support, education, and income. Spinal Cord. 2009;47(8):592-596. doi: 10.1038/sc.2009.15 [DOI] [PMC free article] [PubMed] [Google Scholar]
- 18.Florence C, Haegerich T, Simon T, Zhou C, Luo F. Estimated lifetime medical and work-loss costs of emergency department-treated nonfatal injuries—United States, 2013. MMWR Morb Mortal Wkly Rep. 2015;64(38):1078-1082. doi: 10.15585/mmwr.mm6438a5 [DOI] [PubMed] [Google Scholar]
- 19.Parachute Canada The cost of injury in Canada. Published June 2015. Accessed September 22, 2020. https://parachute.ca/wp-content/uploads/2019/06/Cost_of_Injury-2015.pdf
- 20.Brenneman FD, Redelmeier DA, Boulanger BR, McLellan BA, Culhane JP. Long-term outcomes in blunt trauma: who goes back to work? J Trauma. 1997;42(5):778-781. doi: 10.1097/00005373-199705000-00004 [DOI] [PubMed] [Google Scholar]
- 21.Gross T, Schüepp M, Attenberger C, Pargger H, Amsler F. Outcome in polytraumatized patients with and without brain injury. Acta Anaesthesiol Scand. 2012;56(9):1163-1174. doi: 10.1111/j.1399-6576.2012.02724.x [DOI] [PubMed] [Google Scholar]
- 22.Michaels AJ, Michaels CE, Smith JS, Moon CH, Peterson C, Long WB. Outcome from injury: general health, work status, and satisfaction 12 months after trauma. J Trauma. 2000;48(5):841-848. doi: 10.1097/00005373-200005000-00007 [DOI] [PubMed] [Google Scholar]
- 23.Rios-Diaz AJ, Herrera-Escobar JP, Lilley EJ, et al. Routine inclusion of long-term functional and patient-reported outcomes into trauma registries: the FORTE project. J Trauma Acute Care Surg. 2017;83(1):97-104. doi: 10.1097/TA.0000000000001490 [DOI] [PubMed] [Google Scholar]
- 24.Soberg HL, Finset A, Bautz-Holter E, Sandvik L, Roise O. Return to work after severe multiple injuries: a multidimensional approach on status 1 and 2 years postinjury. J Trauma. 2007;62(2):471-481. doi: 10.1097/TA.0b013e31802e95f4 [DOI] [PubMed] [Google Scholar]
- 25.Kendrick D, Vinogradova Y, Coupland C, Christie N, Lyons RA, Towner EL; UK Burden of Injuries Study Group . Getting back to work after injury: the UK Burden of Injury multicentre longitudinal study. BMC Public Health. 2012;12:584. doi: 10.1186/1471-2458-12-584 [DOI] [PMC free article] [PubMed] [Google Scholar]
- 26.Sanmartin C, Reicker A, Dasylva A, et al. Data resource profile: the Canadian Hospitalization and Taxation Database (C-HAT). Int J Epidemiol. 2018;47(3):687-687g. doi: 10.1093/ije/dyy038 [DOI] [PubMed] [Google Scholar]
- 27.Haas B, Xiong W, Brennan-Barnes M, Gomez D, Nathens AB. Overcoming barriers to population-based injury research: development and validation of an ICD10-to-AIS algorithm. Can J Surg. 2012;55(1):21-26. doi: 10.1503/cjs.017510 [DOI] [PMC free article] [PubMed] [Google Scholar]
- 28.Haas B, Gomez D, Zagorski B, Stukel TA, Rubenfeld GD, Nathens AB. Survival of the fittest: the hidden cost of undertriage of major trauma. J Am Coll Surg. 2010;211(6):804-811. doi: 10.1016/j.jamcollsurg.2010.08.014 [DOI] [PubMed] [Google Scholar]
- 29.Fransoo R, Yogendran M, Olafson K, Ramsey C, McGowan KL, Garland A. Constructing episodes of inpatient care: data infrastructure for population-based research. BMC Med Res Methodol. 2012;12:133. doi: 10.1186/1471-2288-12-133 [DOI] [PMC free article] [PubMed] [Google Scholar]
- 30.Nathens AB, Cryer HG, Fildes J. The American College of Surgeons Trauma Quality Improvement Program. Surg Clin North Am. 2012;92(2):441-454. doi: 10.1016/j.suc.2012.01.003 [DOI] [PubMed] [Google Scholar]
- 31.Iacus SM, King G, Porro G. Causal inference without balance checking: coarsened exact matching. Political Analysis 2012;20(1):1-24. doi: 10.1093/pan/mpr013 [DOI] [Google Scholar]
- 32.Canadian Institute for Health Information Care in Canadian ICUs. Published 2016. Accessed March 17, 2019.https://secure.cihi.ca/free_products/ICU_Report_EN.pdf
- 33.Bank of Canada Historical noon and closing rates. Accessed September 28, 2020. https://www.bankofcanada.ca/rates/exchange/legacy-noon-and-closing-rates/?page_moved=1.
- 34.Statistics Canada Low income cut-offs (LICOs) before and after tax by community size and family size, in current dollars: table 11-10-0241-01. Updated September 28, 2020. Accessed September 28, 2020. https://www150.statcan.gc.ca/t1/tbl1/en/tv.action?pid=1110024101
- 35.Scott JW, Neiman PU, Uribe-Leitz T, et al. Impact of Affordable Care Act-related insurance expansion policies on mortality and access to post-discharge care for trauma patients: an analysis of the National Trauma Data Bank. J Trauma Acute Care Surg. 2019;86(2):196-205. doi: 10.1097/TA.0000000000002117 [DOI] [PubMed] [Google Scholar]
- 36.Scott JW, Raykar NP, Rose JA, et al. Cured into destitution: catastrophic health expenditure risk among uninsured trauma patients in the United States. Ann Surg. 2018;267(6):1093-1099. doi: 10.1097/SLA.0000000000002254 [DOI] [PubMed] [Google Scholar]
- 37.Disease GBD, Injury I, Prevalence C; GBD 2017 Disease and Injury Incidence and Prevalence Collaborators . Global, regional, and national incidence, prevalence, and years lived with disability for 354 diseases and injuries for 195 countries and territories, 1990-2017: a systematic analysis for the Global Burden of Disease Study 2017. Lancet. 2018;392(10159):1789-1858. doi: 10.1016/S0140-6736(18)32279-7 [DOI] [PMC free article] [PubMed] [Google Scholar]
- 38.Spreadborough S, Radford K, das Nair R, Brooks A, Duffy M. A study of outcomes of patients treated at a UK major trauma centre for moderate or severe injuries one to three years after injury. Clin Rehabil. 2018;32(3):410-418. doi: 10.1177/0269215517730862 [DOI] [PubMed] [Google Scholar]
- 39.Uleberg O, Pape K, Kristiansen T, Romundstad PR, Klepstad P. Population-based analysis of the impact of trauma on longer-term functional outcomes. Br J Surg. 2019;106(1):65-73. doi: 10.1002/bjs.10965 [DOI] [PubMed] [Google Scholar]
- 40.Collie A, Simpson PM, Cameron PA, et al. Patterns and predictors of return to work after major trauma: a prospective, population-based registry study. Ann Surg. 2019;269(5):972-978. doi: 10.1097/SLA.0000000000002666 [DOI] [PubMed] [Google Scholar]
- 41.Haider AH, Herrera-Escobar JP, Al Rafai SS, et al. Factors associated with long-term outcomes after injury: results of the Functional Outcomes and Recovery After Trauma Emergencies (FORTE) multicenter cohort study. Ann Surg. 2020;271(6):1165-1173. doi: 10.1097/SLA.0000000000003101 [DOI] [PubMed] [Google Scholar]
- 42.Heckman J, Ichimura H, Todd P. Matching as an econometric evaluation estimator: evidence from evaluating a job training programme. Rev Econ Stud 1997;64:605-54. doi: 10.2307/2971733 [DOI] [Google Scholar]
- 43.Statistics Canada Income of individuals by age group, sex and income source, Canada, provinces and selected census metropolitan areas. Accessed March 17, 2019. https://www150.statcan.gc.ca/t1/tbl1/en/tv.action?pid=1110023901
Associated Data
This section collects any data citations, data availability statements, or supplementary materials included in this article.
Supplementary Materials
eAppendix 1. Methods: Datasets and Linkage.
eTable 1. ICD-10-CA inclusion/exclusion criteria for exposed and unexposed control cohorts.
eAppendix 2. Methods: Analysis.
eTable 2. Baseline characteristics for the severe traumatic injury and controls cohorts.
eTable 3. Baseline characteristics for the severe traumatic injury with severe head injury and control cohorts.
eTable 4. Labor market outcomes, weighted, by year and cohort.
eTable 5. Impact of severe traumatic injury on employment and earning, by post-event year
eTable 6. Absolute and relative magnitudes of earnings changes in the third year after severe traumatic injury, by earnings tercile in the year prior to injury.
eTable 7. Percentage of original health shock cohorts lost in reweighting for heterogeneity analysis
eReferences. Supplemental References.