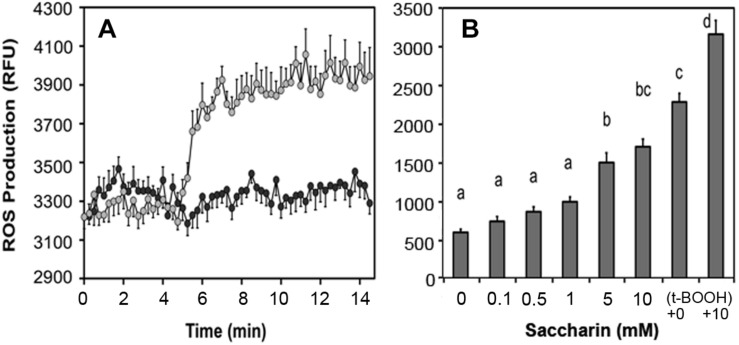
FIGURE 7.
Effect of saccharin on ROS production in clonal pancreatic β-cells (A) and human adipocytes (B). A, Dark circles are vehicle, light circles are 5 mM saccharin. B, Concentration-dependent ROS production in cultured, differentiated human adipocytes in response to increasing concentrations of saccharin. The positive controls are tert-butyl hydroperoxide (t-BOOH) with and without 10 mM saccharin.

