. 2020 Apr 17;11(5):559–568. doi: 10.1039/d0md00011f

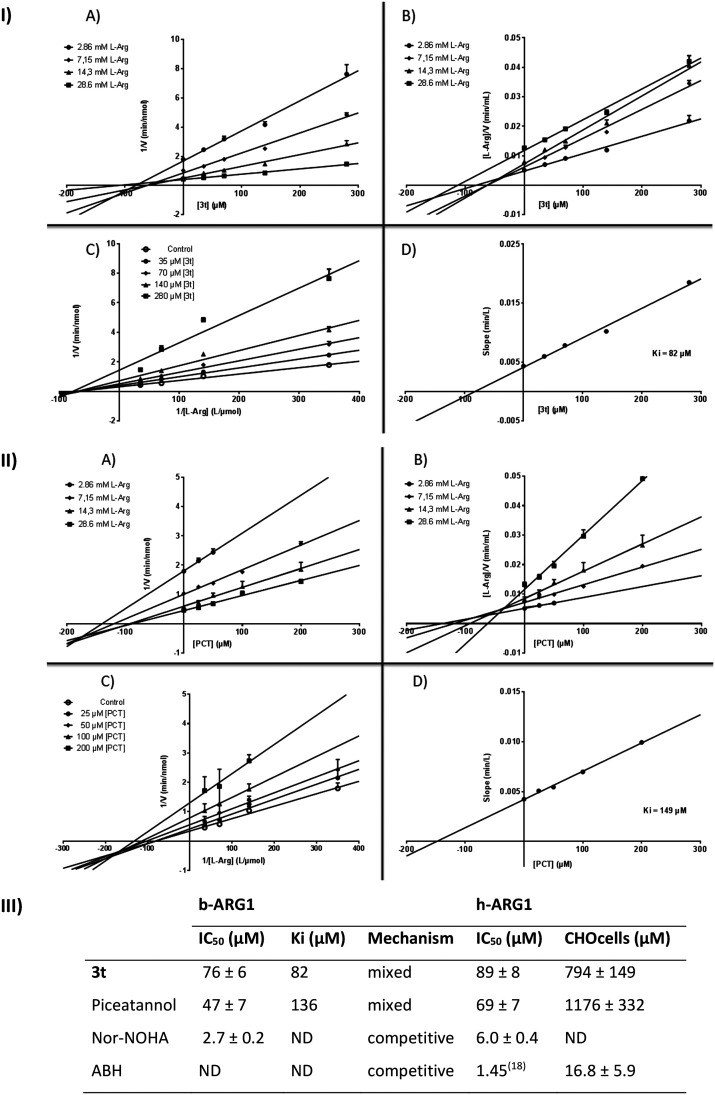
Fig. 8. Dose–response curves, IC50, Ki and mechanism on b-ARG1; IC50, enzymatic and cell based assay on h-ARG1. I & II. Dose response curves of 3t & piceatannol: A) Dixon (reciprocal enzyme reaction velocity vs. inhibitor concentrations), B) Cornish–Bowden (arginine concentration multiplied by the reciprocal enzyme reaction velocity vs. inhibitor concentrations), slopes are significantly different (p-value < 0.05), C) Lineweaver–Burk (reciprocal velocities vs. reciprocal of substrate concentrations) D) (slopes of Lineweaver–Burk plot vs. inhibitor concentration) plots to allow the determination of the inhibition type and the Ki. III. IC50, Ki, mechanism on b-ARG1; enzymatic and cell based assay on h-ARG1. Values are means ± SD from 3 separate experiments.

Fig. 8