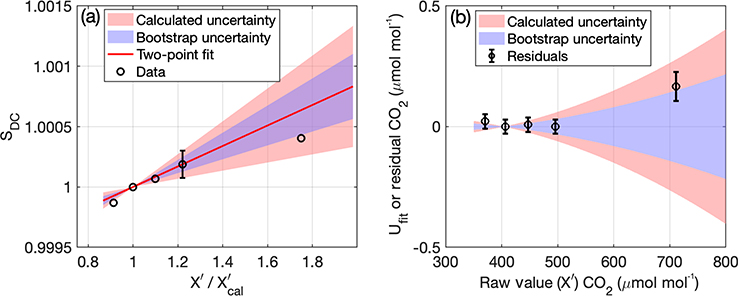
Figure 7.
Uncertainty (1σ) in fit for two-point calibrations. (a) Two-point fit to drift-corrected sensitivity (SDC) (red line) with uncertainty (red shading) calculated using the uncertainty in the high standard (black circle with error bar). Blue shading shows uncertainty calculated using a bootstrap conducted by randomly selecting sets of two standards from the laboratory test (black circles) to calculate the slope. There is no uncertainty at 1 because the drift-corrected sensitivity is defined as equal to one at the value of the calibration standard. (b) Uncertainty in final CO2 as a function of raw CO2; red and blue shading have the same meaning as in (a).

