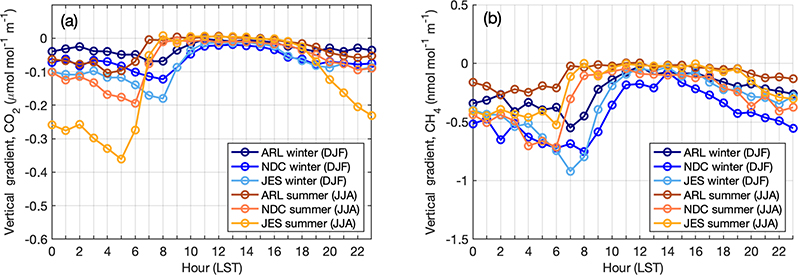
Figure 9.
Diurnal cycle of vertical gradients in CO2 (a) and CH4 (b) for urban towers in the Washington–Baltimore area, averaged over 2015–2017 in winter (blue) and summer (orange), with shading indicating 1σ standard deviation among sites. Some of the spread can be caused by sampling in different years at the different sites. Sites included are HAL, ARL, NDC, NEB, NWB, and JES. HRD was excluded due to lack of data in this period.

