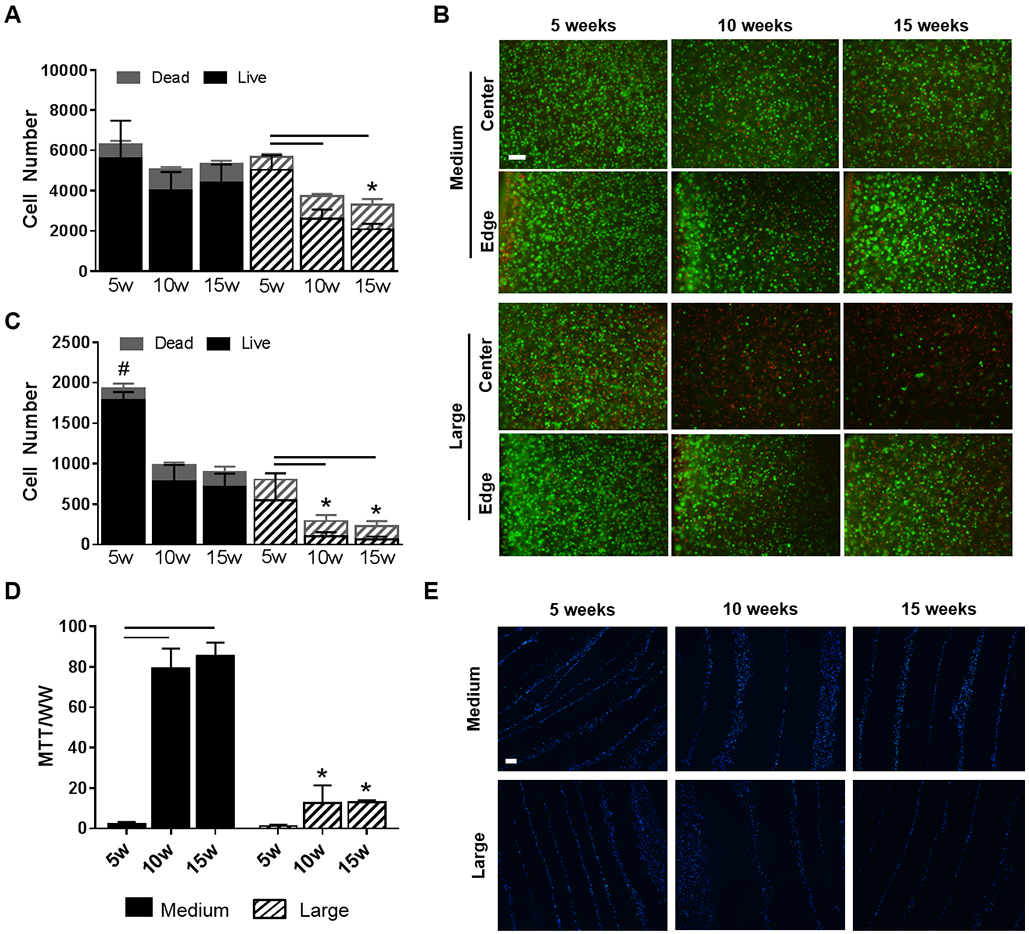
Figure 2. Cell viability and metabolic activity in the NP and AF.

(A) The number of live and dead cells across the entire NP area. (B) Representative live/dead staining (green: live cell nuclei, red: dead cell nuclei) from the edge and center of the NP. Scale = 100 μm. (C) The number of live and dead cells in only the central region of the NP. (D) Metabolic activity of cells in the AF region (as measured by the MTT assay). (E) Representative DAPI staining of the AF region to visualize cell distribution within the AF layers (Blue = cell nuclei). Scale = 100 μm. Bars denote significance between groups. * = p < 0.05 compared to medium DAPS at the corresponding time point, # = p<0.05 compared to all groups.
