
Figure 3. DAPS compressive mechanical properties.
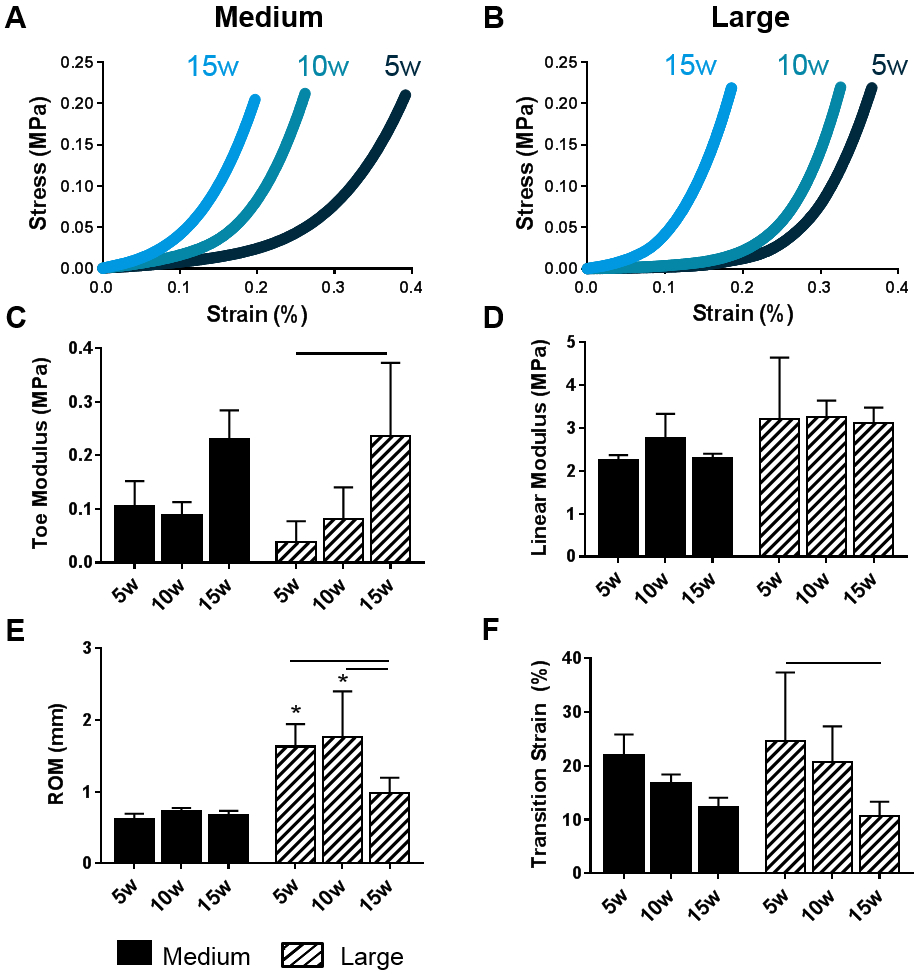
Representative stress-strain curves of (A) medium and (B) large DAPS over the 15 week culture duration. A bi-linear fit was utilized to quantify (C) toe modulus, (D) linear modulus, (E) range of motion, and (F) transition strain. Bars denote significance between groups. * = p <0.05 compared to medium DAPS at the corresponding time point.