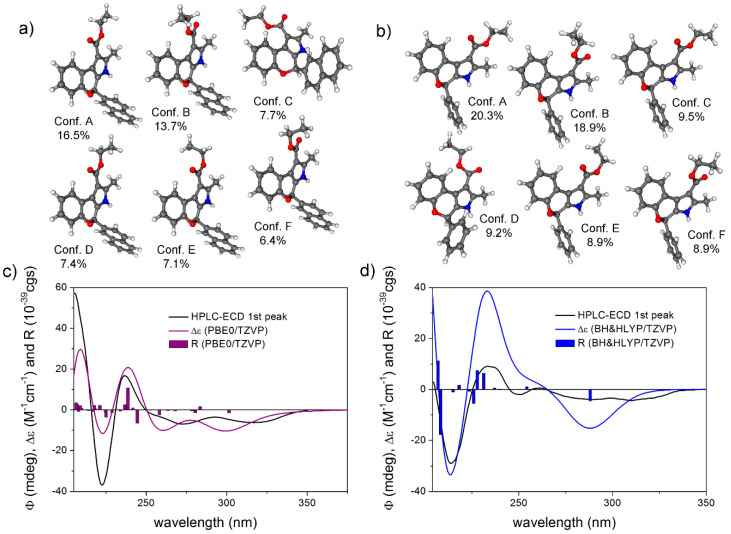
Figure 6.
Structures and populations of (a) the six lowest energy ωB97X/TZVP PCM/CHCl3 conformers of (R)-4g, (b) six lowest energy ωB97X/TZVP PCM/CHCl3 conformers of (R)-4a. HPLC-ECD spectra of the first-eluting enantiomer (black line) of (c) 4g compared with the PBE0/TZVP PCM/CHCl3//ωB97X/TZVP PCM/CHCl3 spectrum of (R)-4g (purple line), (d) 4a compared with the PBE0/TZVP PCM/CHCl3//ωB97X/TZVP PCM/CHCl3 spectrum of (R)-4a (blue line). The bars represent rotational strength values for the lowest-energy solution conformer.

