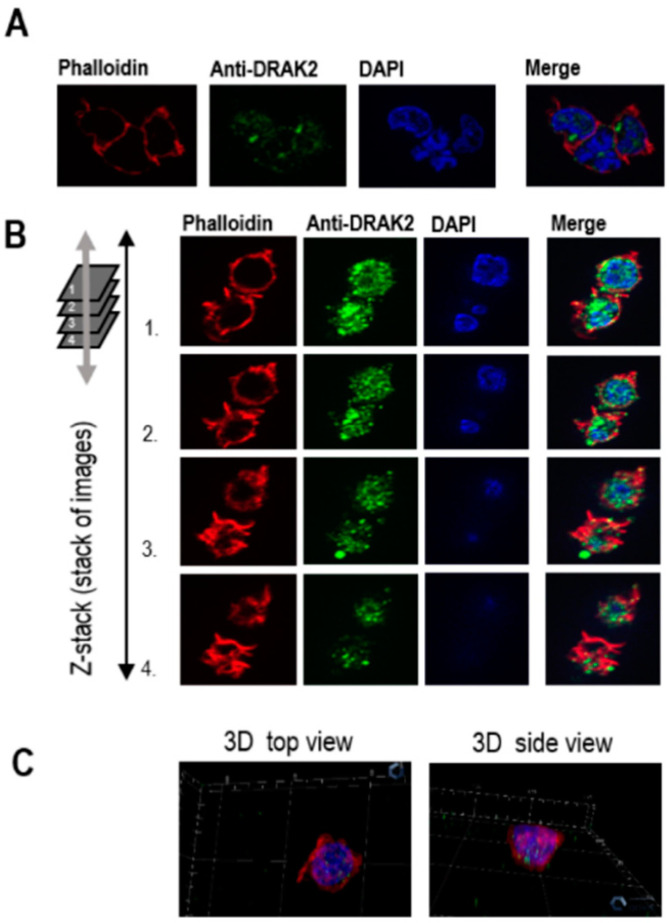
Figure 3.
Immunofluorescence analyses of DRAK2 cellular localization in MEC-1 cells. MEC-1 cells were stained with different fluorophores to visualize cellular compartments: cytoplasm/actin filaments (visualized with phalloidin) and nucleus (visualized with DAPI). Cells were analyzed using a ZEISS Axio Imager microscope. Z1 to generate 2D view (A) using ZEISS Apotome that allows the collection of confocal-like “Z” stacks to project images, as shown in 3D (B,C).

