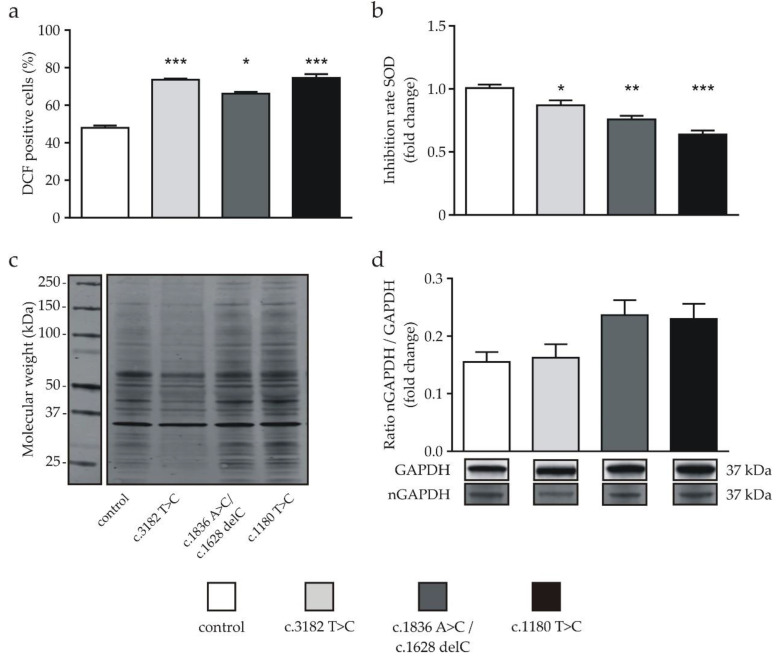
Figure 1.
Determination of oxidative stress markers in neuronal differentiated cells. (a) Significantly increased reactive oxygen species (ROS) levels of Niemann-Pick type C1 (NPC1)-deficient cell lines in comparison to the control cell line detected by the flow cytometry analysis of DCF fluorescence (n = 16–18). (b) Significantly decreased superoxide dismutase (SOD) activity was observed in the NPC1-deficient cells compared to the control (n = 10–22). (c) Determination of nitrated proteins as an oxidative stress marker. NPC1-deficient cell lines displayed distinct patterns of bands with a molecular weight below 150 kDa and above ~50 kDa. An example of complete gel is shown Supplementary Figure S2. (d) The ratio of nitrated proteins located at the 37-kDa (nitrated glycerinealdehyd-3-phosphat-dehydrogenase (nGAPDH)) band and the amount of GAPDH (GAPDH) was increased in two NPC1-deficient cell lines; the amount of nitrated GAPDH was not significantly different (n = 11–21). Cropped bands are shown as an example and display corresponding examples of the same gel (n = 10–26). * = p < 0.05, ** = p < 0.01 and *** = p < 0.001. Statistical tests used: (a) one-way ANOVA with Kruskal-Wallis multiple comparison test, (b,d) ordinary one-way ANOVA with Dunnett’s multiple comparisons test. See also the Materials and Methods section.

