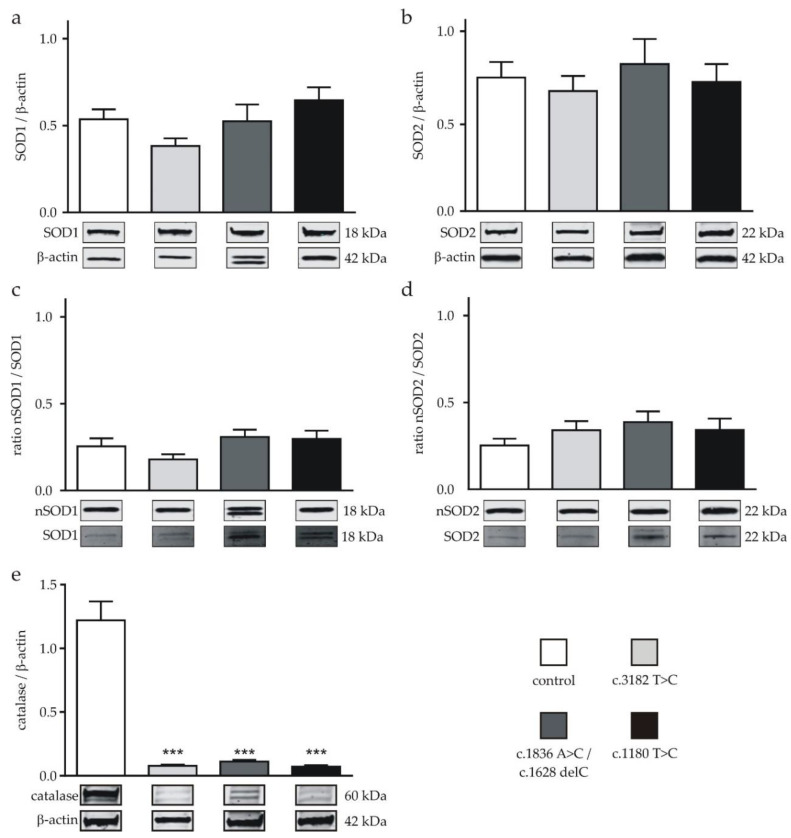
Figure 3.
Protein expression of SOD and nitrated (n)SOD and catalase in neuronal differentiated cells. (a) Expression of SOD1 and (b) SOD2 of all NPC1-deficient cell lines was not different to the corresponding amounts in the control cell line (n = 10–13). (c) The ratio of the nitrated proteins located at the 22-kDa (nSOD1) band to the total SOD1 and (d) the ratio of nitrated proteins located at the 22-kDa (nSOD2) band to the total SOD2 were similar in all cell lines (n = 4–13). (e) The expression of catalase was significantly lowered in all NPC1-deficient cell lines (n = 10–13). Double bands, observed for catalase, most likely represent isoforms of the protein. Western blot bands display corresponding examples of the same gel. An example of a complete gel is shown in Supplementary Figure S3. *** = p < 0.001. Statistical tests used: (a–e) ordinary one-way ANOVA with Dunnett´s multiple comparisons test. See also the Materials and Methods section.

