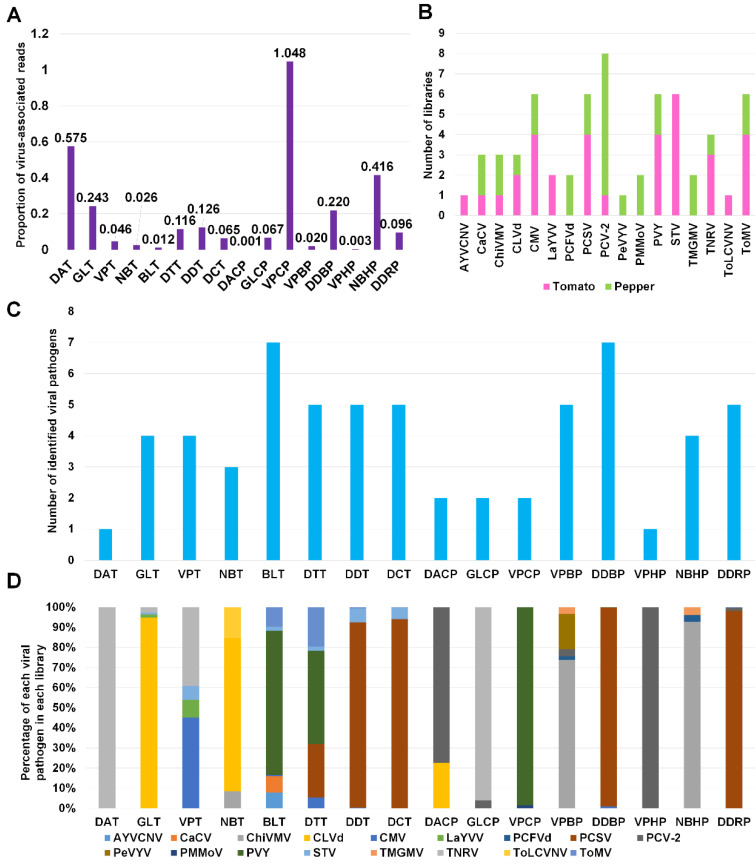
Figure 4.
The viral population of identified viral pathogens in each library. (A) The proportion of virus-associated reads in each library. (B) The frequency of identified viral pathogens in different tomato and pepper libraries. Purple- and green-colored bars indicate the number of libraries for tomato and pepper plants, respectively, in which viral pathogens were infected. (C) The number of identified virus and viroid species in each library. (D) The viral population of identified viral pathogens in each library based on the number of virus-associated reads.

