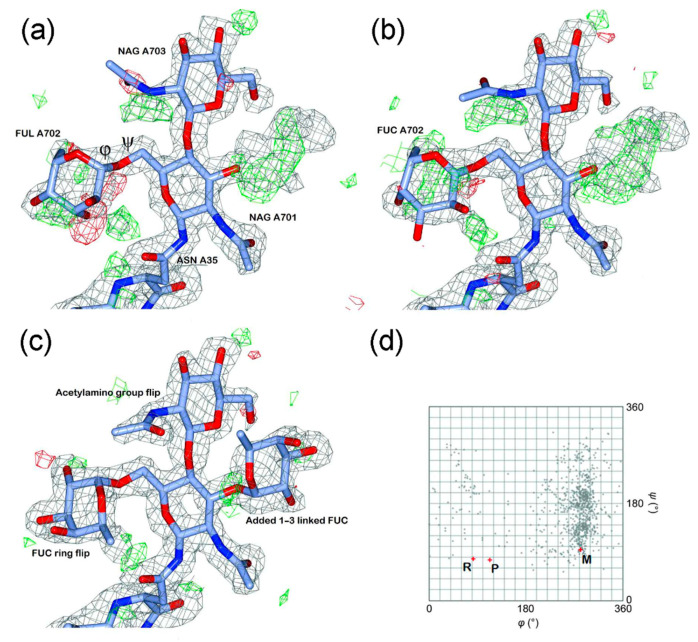
Figure 7.
X-ray diffraction data refinement of N-glycan moiety from PDB ID 2Z62. 2mFo–DFc electron density map contoured at 1σ is displayed in grey; positive and negative mFo–DFc difference electron density maps contoured at 3σ are displayed in green and red, respectively. (a) Original glycan structure model from the PDB entry. (b) PDB-REDO model with properly renamed fucose residue and improved fit to the electron density. (c) Manually rebuilt model based on PDB-REDO results. (d) CARP distribution plot for glycosidic φ-ψ torsions of FUC(1-6)NAG (from panel (a)) in PDB. Characteristic points: R, model refined with PDB-REDO; P, original PDB model; M, manually rebuilt model. Reproduced from [295], © 2020 The authors. Published by John Wiley & Sons, Inc.

