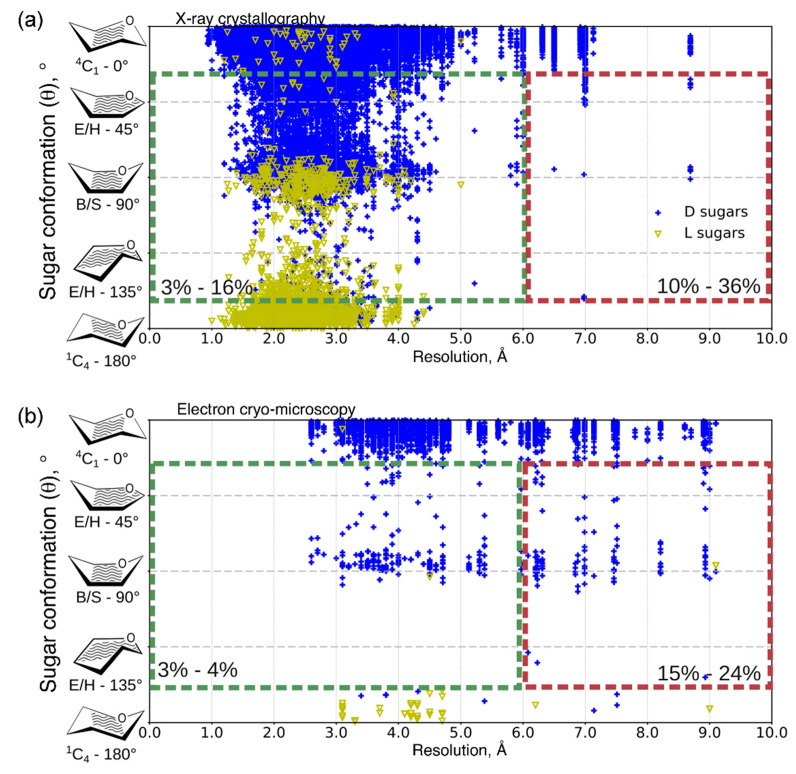
Figure 9.
Distribution of D- (shown in blue) and L-pyranoside (shown in yellow) ring conformations as function of resolution for all sugar moieties in N-glycosylated proteins in PDB (on April 2019) solved with (a) X-ray crystallography and (b) electron cryo-microscopy. Non-chair conformations are bordered by dotted line boxes for 0.0-6.0 Å (green) and 6.0-10.0 Å (red) resolution ranges; the percentage of structures is given in the boxes. Reproduced with permission from [301], © 2020 Elsevier Ltd.

