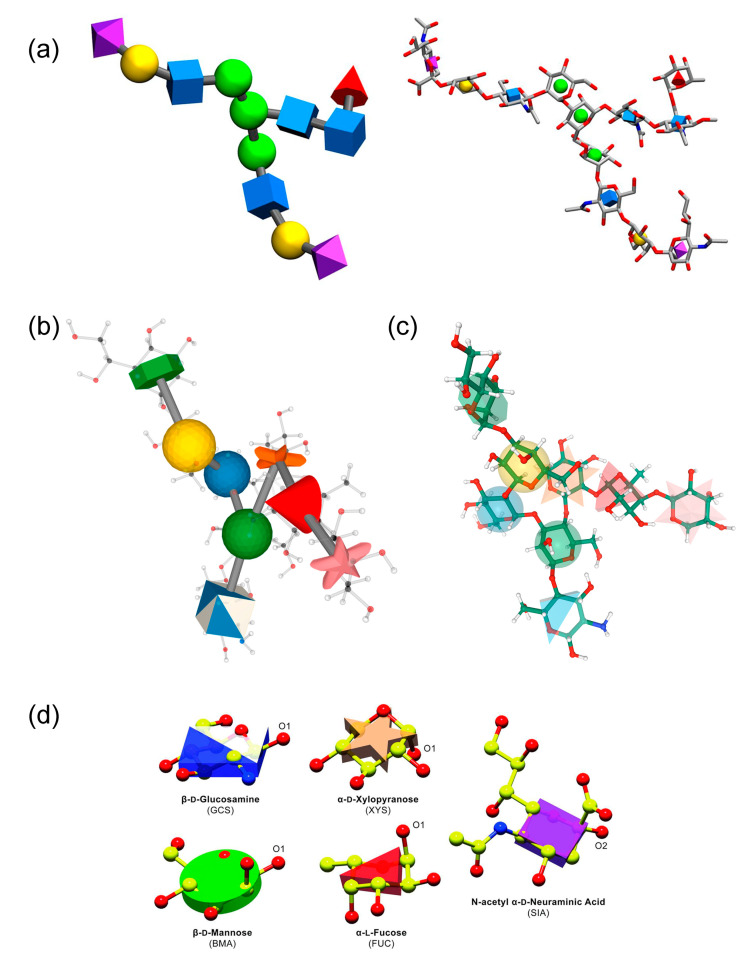
Figure 12.
Glycan structure colored according to SNFG, or superimposed with 3D SNFG, as implemented in 3D-SNFG (a), LiteMol (b), Mol* (c); monosaccharide presentation in Glycoblocks (d). Panel (a) was reproduced with permission from [366], © 2020, Oxford University Press. Panel (d) was reproduced from [369], © 2020 The authors. Published by John Wiley & Sons, Inc.

