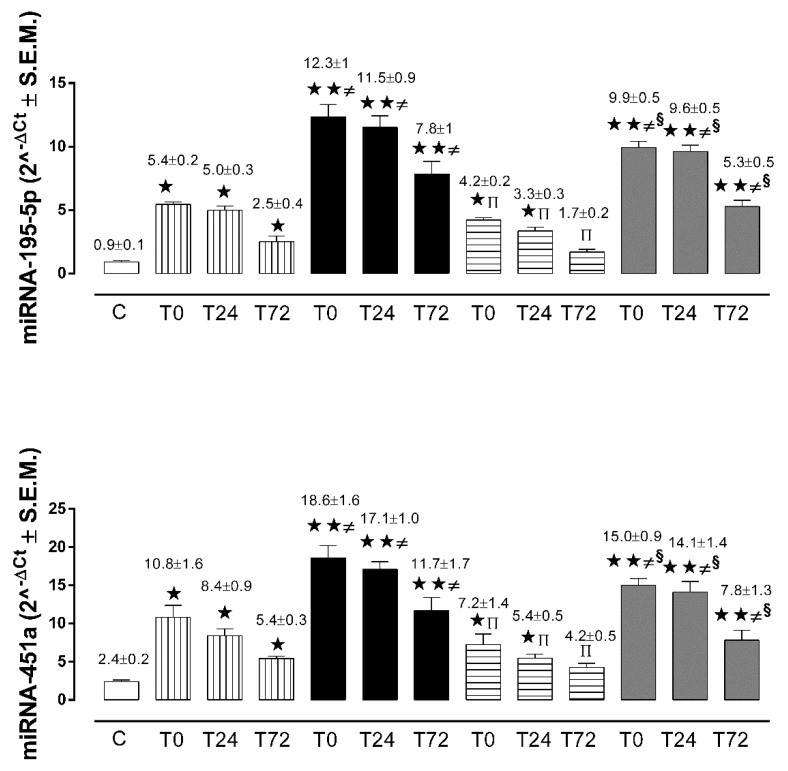
Figure 1.
Micro-RNA (miRNA)-195-5p and miRNA-451a expression levels as mean of 2^-ΔCt ± S.E.M. in control subjects (white column), in non-diabetic AIS patients (vertical line column), in non-diabetic TIA patients (horizontal line column), in diabetic AIS patients (black column), and in diabetic TIA patients (grey column).  p < 0.05 vs. C;
 p < 0.01 vs. C; ≠
p < 0.05 vs. ND at the same time point; π
p < 0.05 vs. non-diabetic AIS at same time point; §
p < 0.05 vs. diabetic AIS at same time point.

