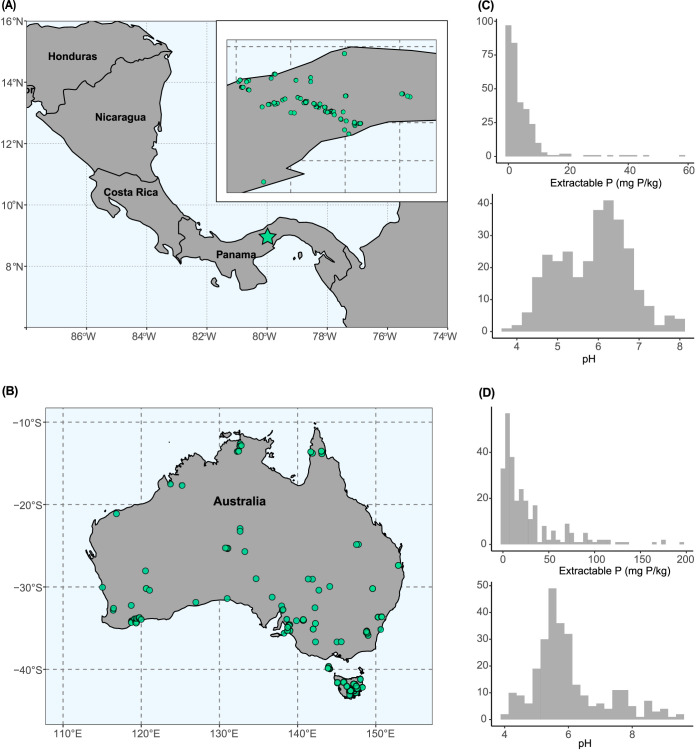
FIG 1.
Description of the soil collection effort and the distribution of available phosphorus concentrations across all samples. (A) Panama (n = 308 soils for 16S rRNA gene amplicon sequencing and 92 soils for shotgun metagenomics) and (B) Australia (n = 275 soils for both 16S rRNA gene amplicon sequencing and shotgun metagenomics). (C) A density plot displaying the distribution of available phosphorus (log-transformed for analyses) across all Panama soils, as estimated by resin phosphorus availability. (D) The same density plot for Australia soils, as estimated by Colwell phosphorus availability (log-transformed for analyses).

