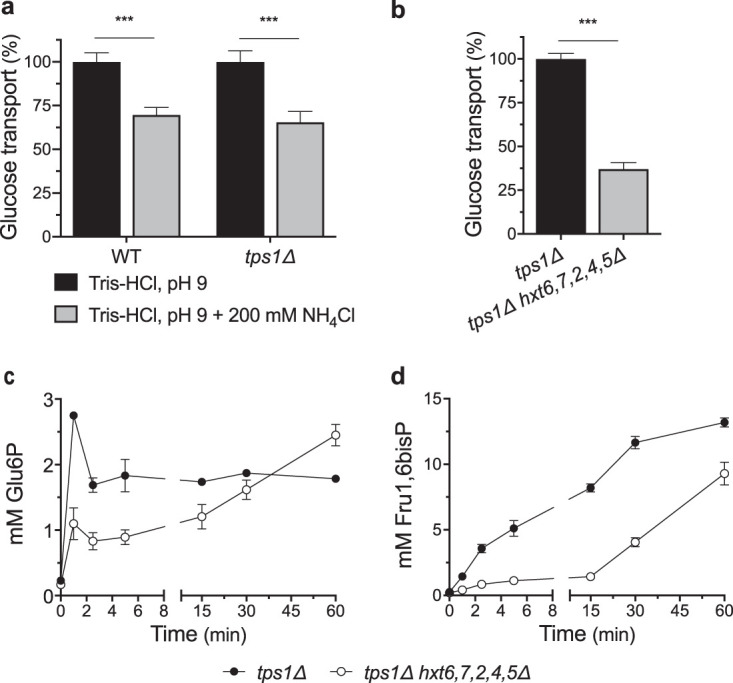
FIG 7.

Reduced glucose transport delays but does not prevent deregulation of glycolytic flux in tps1Δ cells. Relative uptake rate of 100 mM glucose in wild-type and tps1Δ cells in 200 mM Tris-HCl, pH 9, in the absence (black bars) or presence (gray bars) of 200 mM NH4Cl (a) and tps1Δ (black bar) and tps1Δ hxt6,7,2,4,5Δ (gray bar) cells in complete synthetic medium (b). Metabolite profiles for Glu6P (c) and Fru1,6bisP (d) after addition of 100 mM glucose to galactose-grown tps1Δ (closed symbols) or tps1Δ hxt7,6,2,4,5Δ (open symbols) cells. Statistical analysis was performed by two-way ANOVA with Bonferroni’s correction (a) and an unpaired Student's t test (b). ***, P < 0.001.
