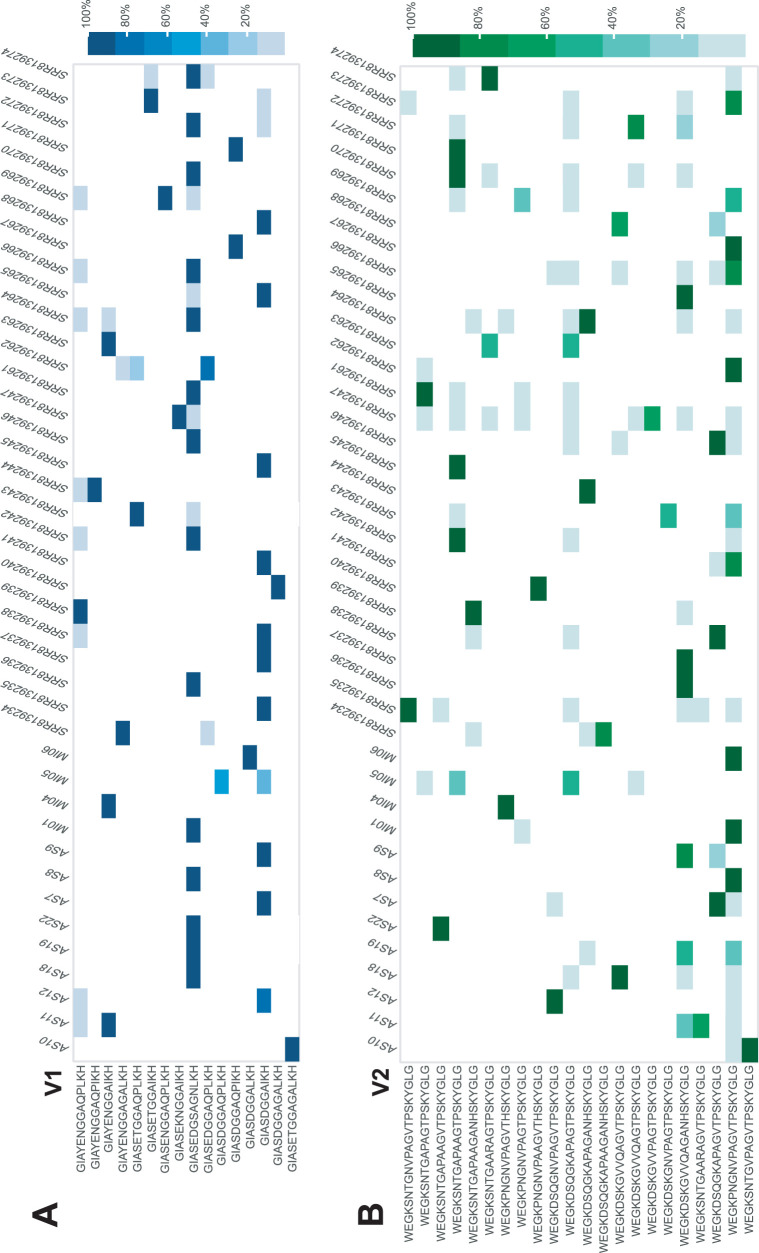
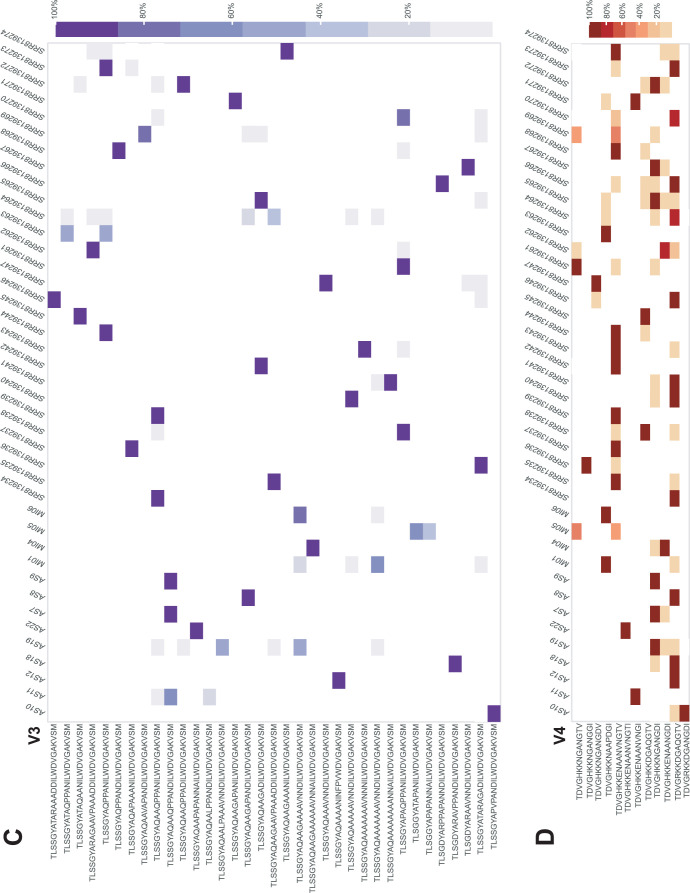
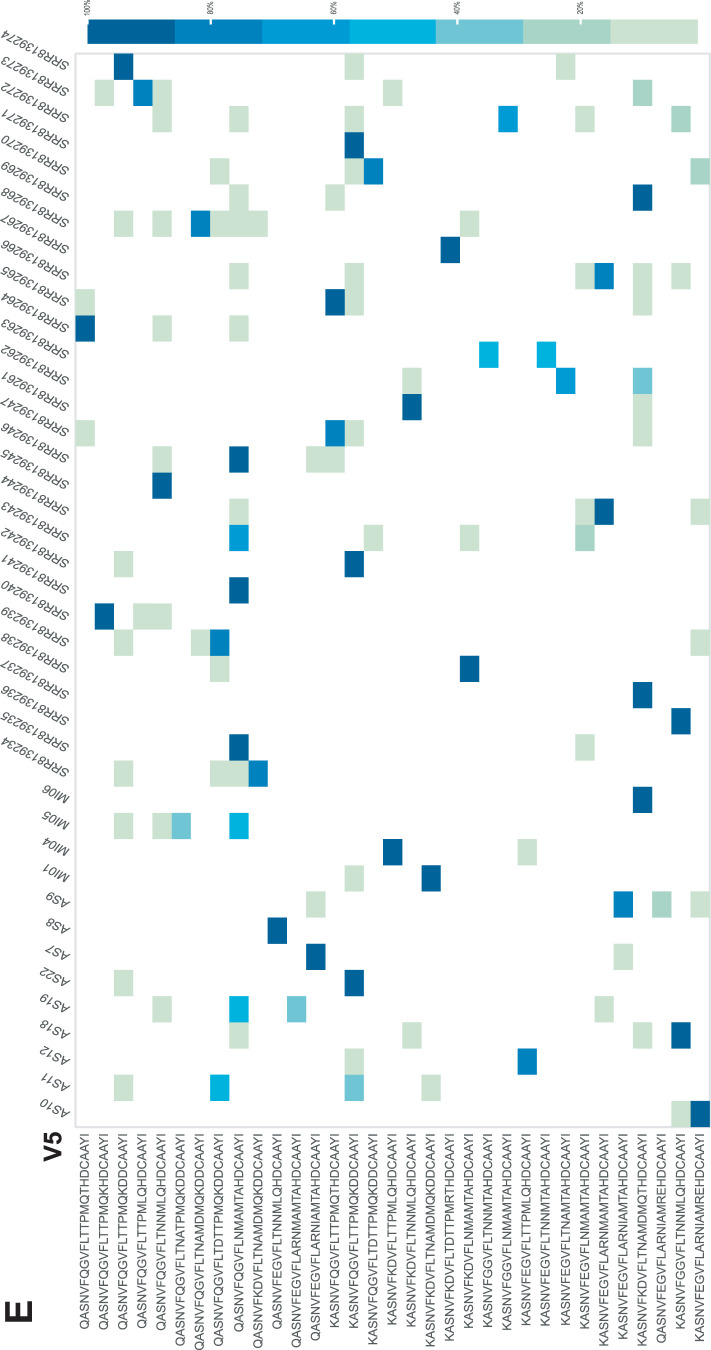
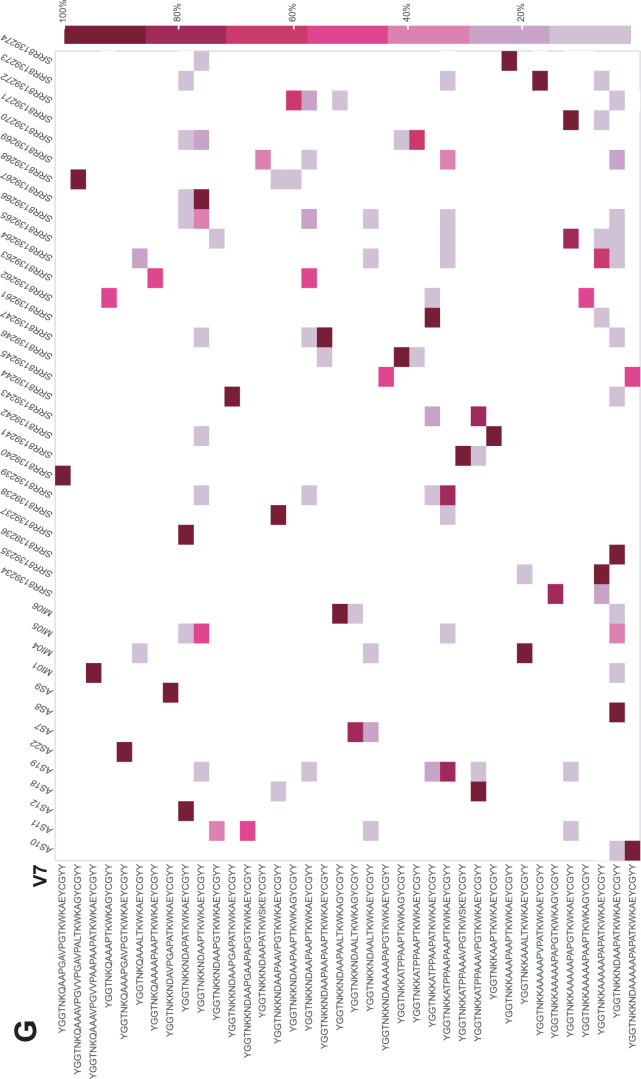
FIG 2.
TprK variable region sequence heatmap. Heatmap display of all deep-sequenced tprK from clinical specimens to date, comprising 13 individuals from Italy sequenced here and 28 Chinese individuals from prior work. For print display, only those variable region sequences present at ≥20% frequency within a sample are depicted. Any variable frequencies less than 2% in other samples are not shown. The proportion of sequences is illustrated by color for each heatmap for V1 (A), V2 (B), V3 (C), V4 (D), V5 (E), V6 (F), and V7 (G). A heatmap filtered at a frequency of 1% is provided as an interactive html in Data Set S2.


