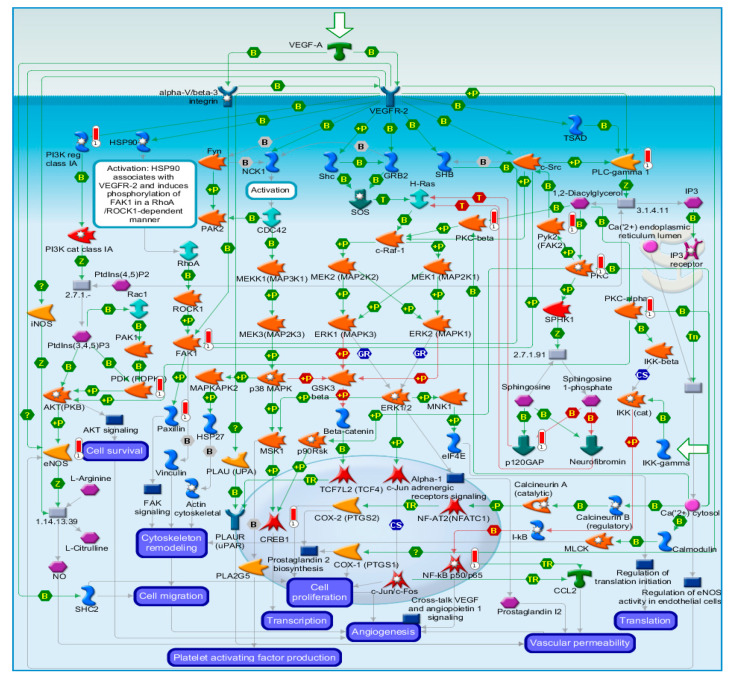
Figure 1.
Pathway analysis map showing VEGF signaling via VEGFR-2 generic cascades. Experimental data are projected onto and visualized on the maps as thermometer-like figures. Upward thermometers are shown in the red color and indicate upregulated phosphorylation levels of the proteins (key of the map: Supplementary Material Figure S1).

