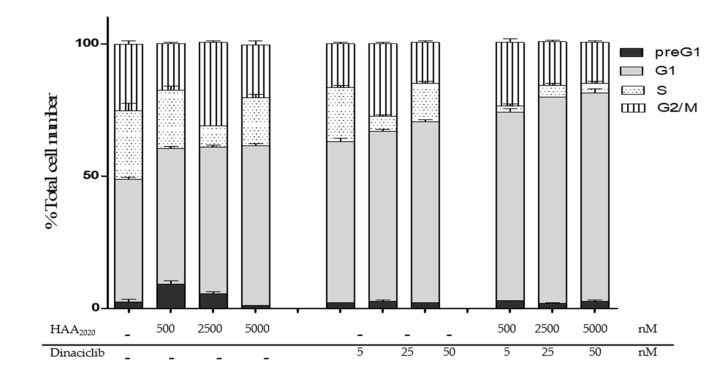
Figure 5.
Cell cycle analysis in MCF7 cells treated for 24 h with either HAA2020 (500, 2500, 5000 nM), dinaciclib (5, 25, 50 nM) or their combinations. Cell cycle phases: preG1, G1, S, and G2/M. Data is represented as Mean ± SD (n = 3, two independent experiments). Histograms of 20,000 events are presented in supplementary material S4.

