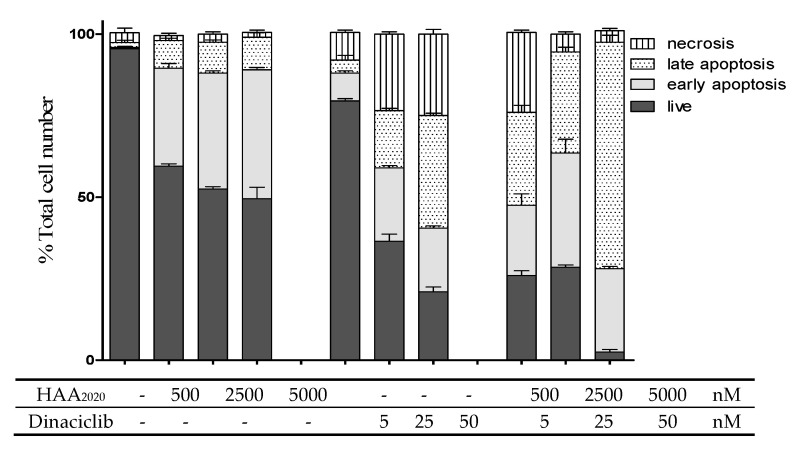
Figure 6.
Detection of apoptosis in MCF7 cells (Total number %, 24 h). Cells were treated with either HAA2020 (500, 2500, 5000 nM), dinaciclib (5, 25, 50 nM) or their combinations. Cells were stained with annexin V FITC/PI. A total of 20,000 single-cell events were acquired on a BC-500 flow cytometer and analyzed by Expo 32 software. Data is represented as mean ±SD (n = 3, two independent experiments). Cell staining status: necrotic cells (annexin V−/PI+), late apoptotic cells (annexin V+/PI+), live cells (annexin V−/PI−), early apoptotic cells (annexin V+/PI−). Histograms are shown in the supplementary material figure S5.

