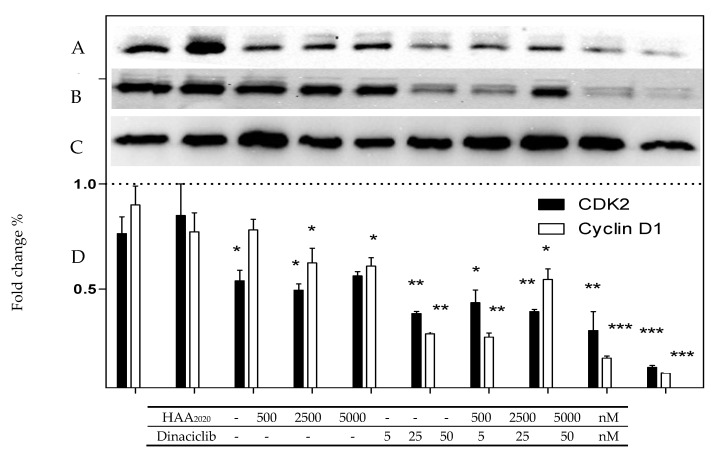
Figure 7.
Level amount of CDK2 and Cyclin D1 in MCF7 cells treated with either HAA2020 (500, 2500, 5000 nM), dinaciclib (5, 25, 50 nM), or their combinations for 24 h. (A–C): immunoblots of CDK2, cyclin D1, and GAPDH, respectively. (D): Data is represented as mean ±SD (n = 2, two independent experiments). Statistical differences of the relative protein levels normalized to GAPDH were assessed by one-way Anova with the Tukey’s post-hoc multiple comparison test. p < 0.05 (*), p < 0.01 (**), and p < 0.001 (***) were taken as significant. Image J software was used for densitometry.

