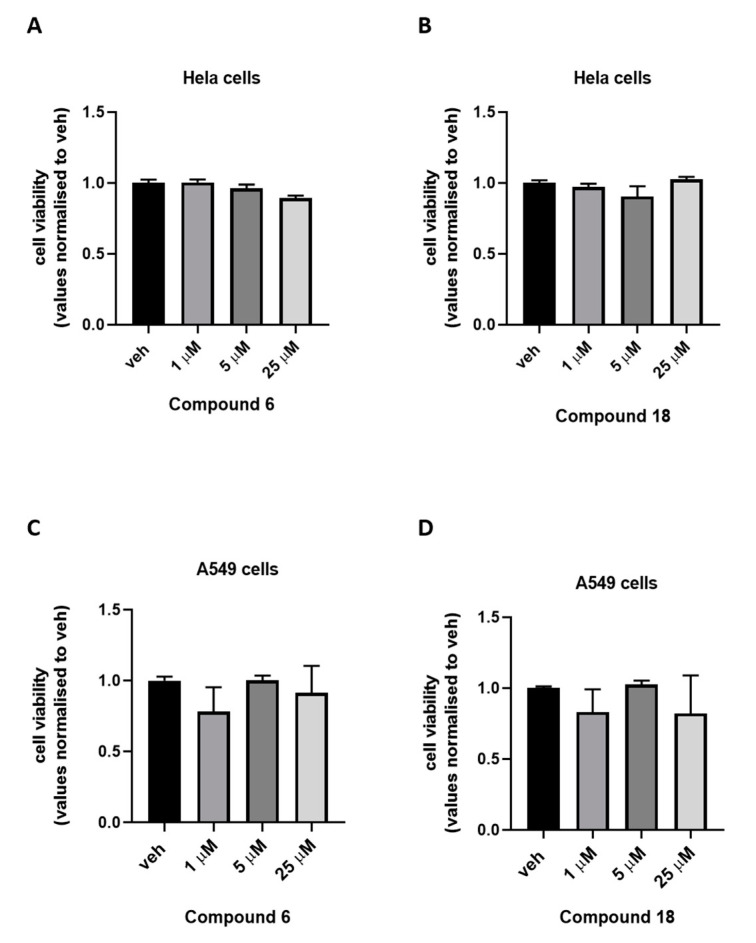
Figure 2.
Cell viability measured in HeLa and A549 cells treated for 24 h with increasing concentration of compound 6 (panel A, C) and 18 (panel B, D). Bar graphs show cell viability measured using the 3-(4,5-dimethylthiazol-2-yl)-2,5-diphenyltetrazolium bromide (MTT) assay. Data are expressed as optical density (OD) at 595 nm, normalized to control (vehicle). The bar is the standard error of the mean (SEM) on 3 independent determinations. Statistically significant differences were accepted when the p-value was at least ≤0.05.

