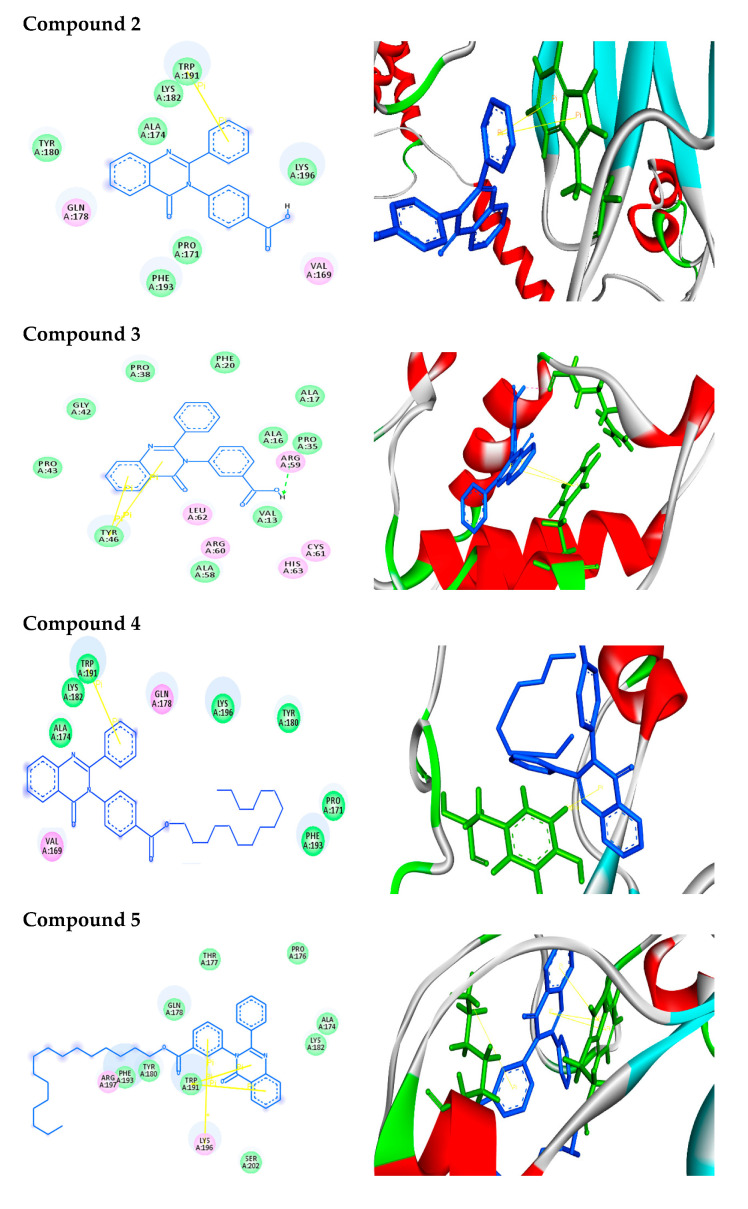
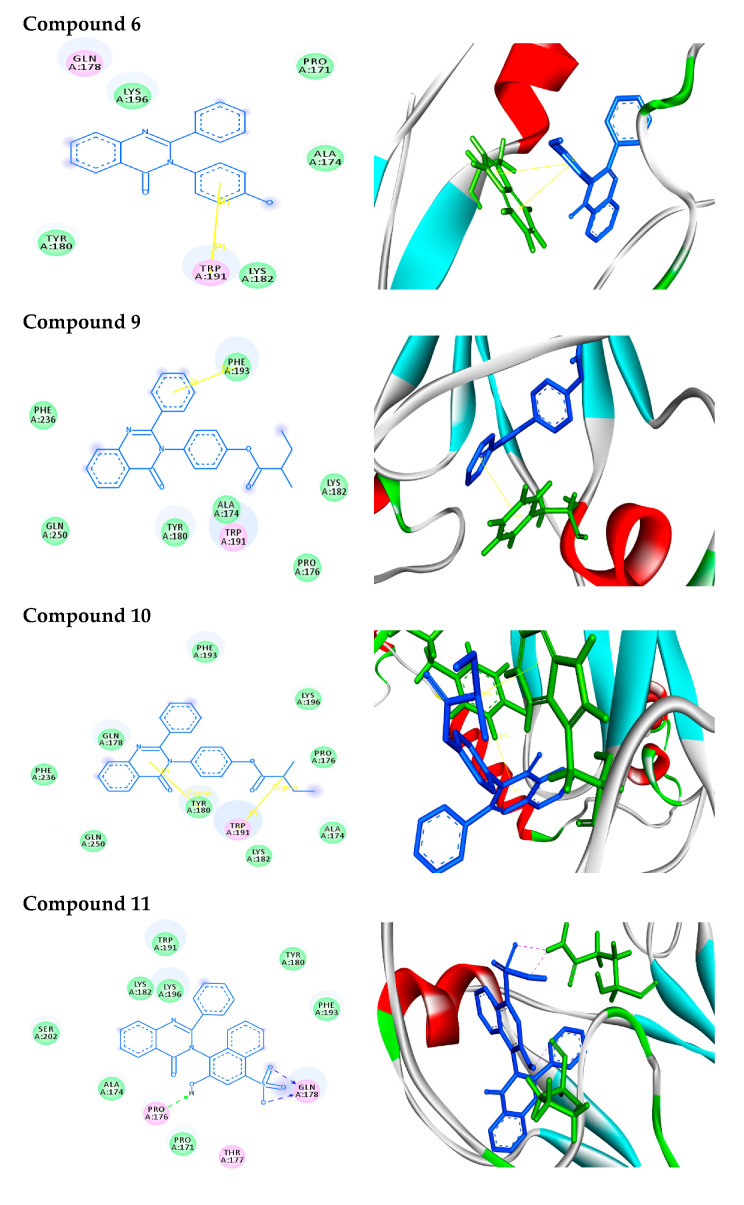
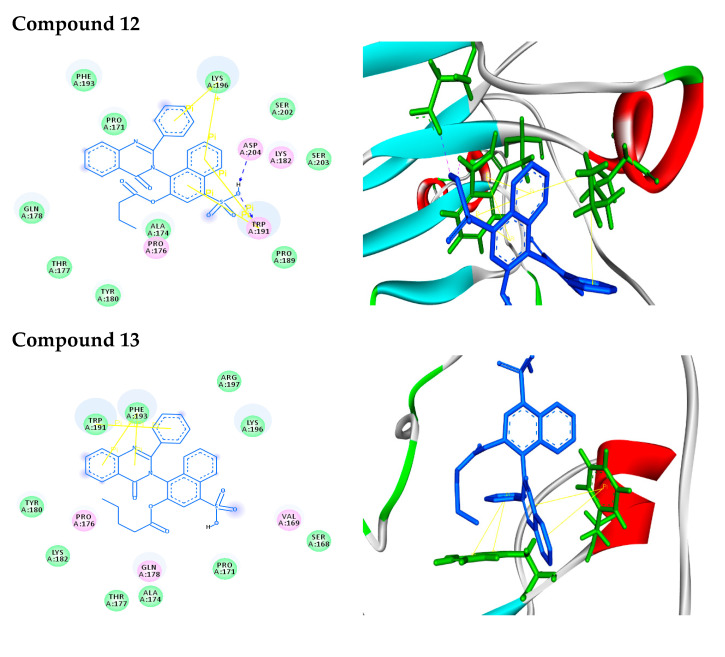
Figure 1.
Binding modes/interactions of the synthetic compounds with active sites of AKT1 protein. (Left side) 2D representations demonstrating the molecular interactions between compounds and the active site region of AKT1 protein. The amino acid residues are shown in three-letter code, H-bonds are in pink doted lines, and π-interactions are in yellow lines. (Right side) 3D representations demonstrating the molecular interactions between compounds and the active site region of AKT1 protein. The compounds are represented by blue stick models, while the active site regions are shown by green stick models. H-bond contacts are shown in pink dotted lines, while -stacking is shown in yellow lines.


