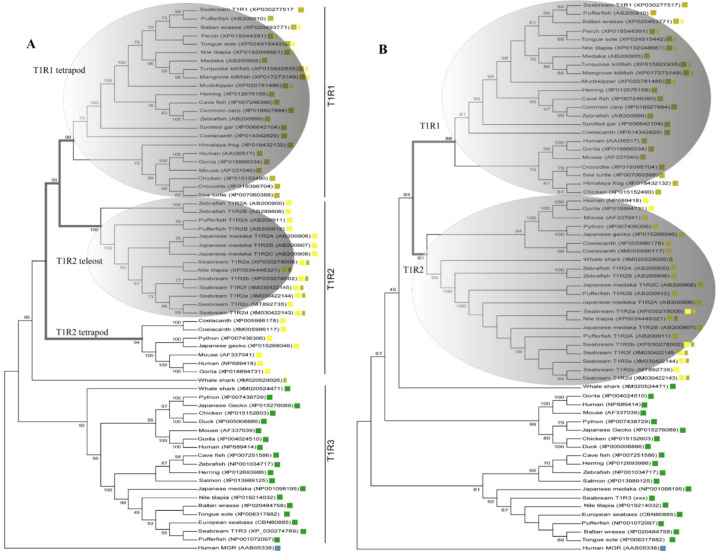
Figure 1.
Phylogenetic relationships inferred by Maximum Likelihood (ML) method of CDS-(A) and VFD-(B) trees using multiple alignments of deduced AA sequences of vertebrate T1Rs ortholog genes. Both evolutionary reconstructions cluster saT1R1, saT1R2a/b/c/d/e/f and saT1R3 genes in three distinct clades ( T1R1;
T1R1;  T1R2;
T1R2;  T1R3) each comprising their respective ortholog genes from mammals, amphibians, birds and reptiles. The (A) topology sets teleost T1R2 genes evolutionarily closer to T1R1 than T1R2 of tetrapod, while two compact T1R1 and T1R2 vertebrate clades are observed in the VFD (B) topology (grey line branches
  ).
).  T1R1 fish AA sequences as deduced from our phylogenetic reconstructions and NCBI-automate-annotated as vertebrate T1R2 orthologs.
  T1R2 fish AA sequences as deduced from our phylogenetic reconstructions and NCBI-automate-annotated as vertebrate T1R1 orthologs. Robustness of the trees was estimated by 1000 random bootstrap replications. Only bootstrap values higher than 50% are shown. The human Metabotropic Glutamate Receptor 1 (MGR1;
  ) was used for rooting the trees. GenBank T1Rs accession numbers are indicated next to species names.

