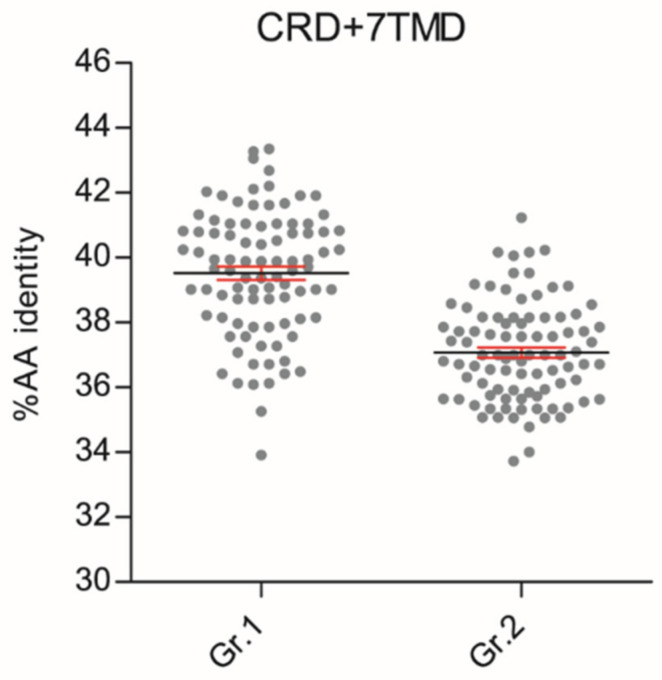
Figure 2.
Scatter plots of amino acid conservation within the 9-Cystein-Rich and heptahelical transmembrane domains (CRD + 7TMD, ± 348 AAs) of fish T1R2 versus tetrapod T1R1 (Gr.1) or tetrapod T1R2 (Gr.2). Each dot represents the percentage of AA sequence identities calculated in one-to-one combinatorial arrangements (n = 90) of fish T1R2s (n = 13) with T1R1 (n = 7) or T1R2 (n = 7) tetrapod sequences. T-test analysis of variance followed by Mann Whitney test was implemented to show significant differences between the two groups (p < 0.0001); percentage AA identity mean (black line) ± SEM (in red).

