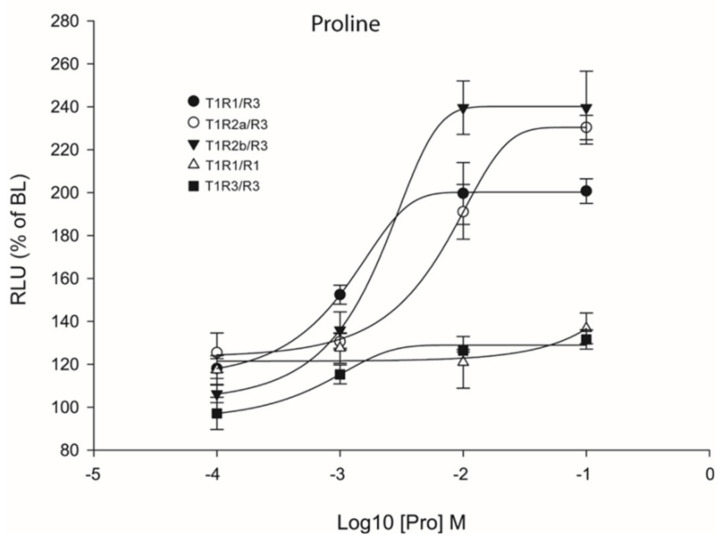
Figure 8.
Comparisons of proline Log-dose response curves of activation in heterologous transfections of hetero- and homo-dimeric saT1R combinations of saT1R1/R3 (black dots), saT1R2a/R3 (white dots), saT1R2b/3 (black triangles), saT1R1/R1 (white triangles) and saT1R3/R3 (black squares). Response is measured as RLU mean ± SEM of four independent determinations normalized to the mean response of the same transfections stimulated with reduced assay medium (BME + 1% FBS), expressed as percentage relative to basal levels (BL).

