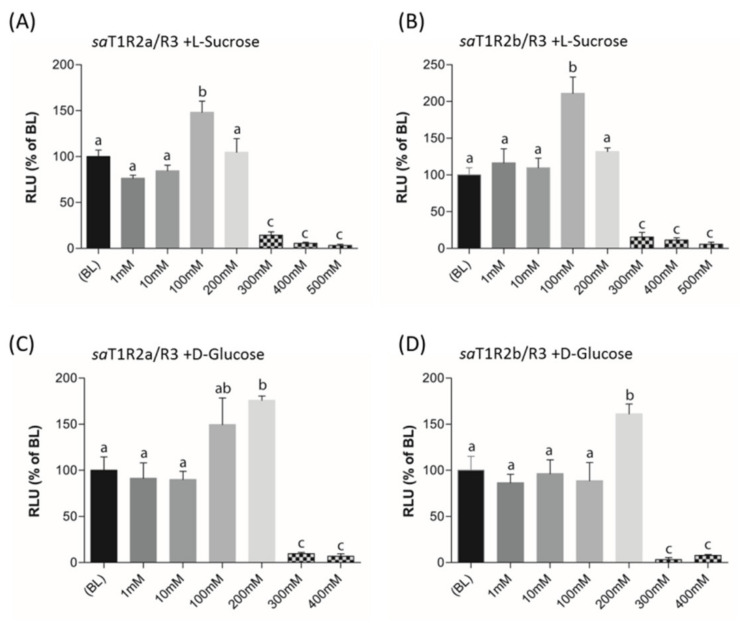
Figure 9.
saT1R2a/R3 and saT1R2b/R3 heterodimer responses to L-Sucrose (A,B) and D-glucose (C,D) at different concentrations (1–500 mM). Evaluation of sugar responses was based on the RLU mean ± SEM of four independent determinations (n = 4) normalized to the mean response of same transfections stimulated with reduced assay medium (BME + 1% FBS). BL (Basal Levels) = 100% RLU. Different lowercase letters (a,b,c) on top of bars indicate significant differences (p < 0.05) between concentrations, assessed by one-way ANOVA followed by Tukey’s Multiple Comparison Test (GraphPad Prism version 5.00).

