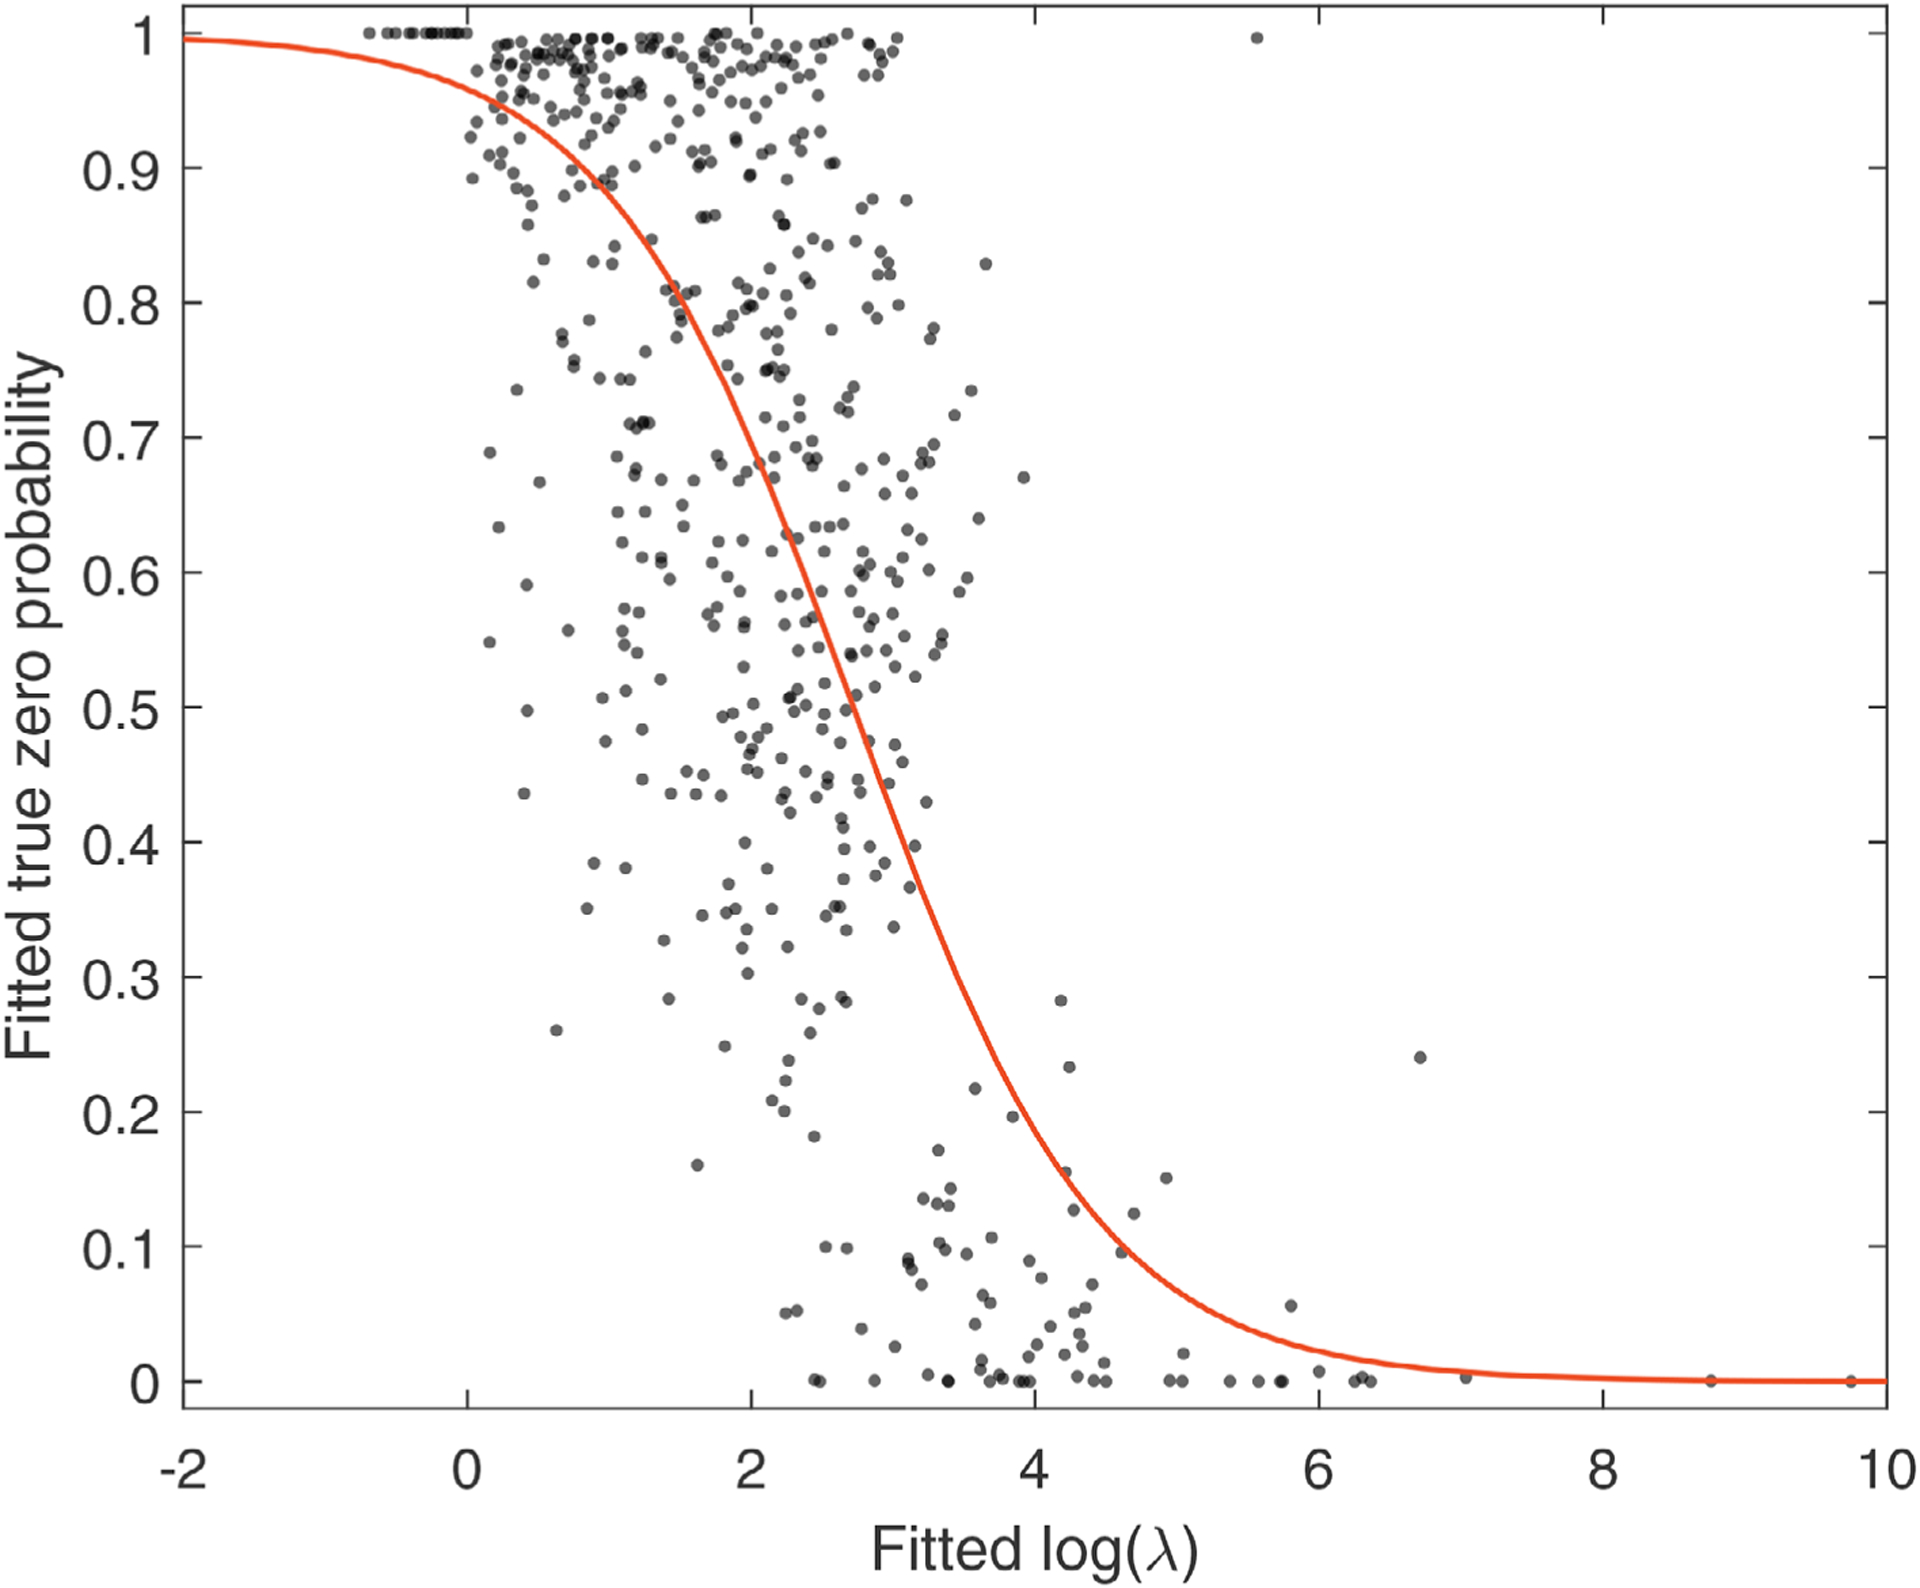
FIGURE 1. Relationship between fitted true zero probability and log expectation in ZINB for each taxon.

Note. The red curve is the fitted logistic function. This figure appears in color in the electronic version of this paper, and any mention of color refers to that version.
